


Why are options so expensive?
Expensive options a great if you are a seller – not so good if you are the buyer, and in the ITM strategy we are the buyers of options. I have been getting a lot of questions about this recently so I though that I would do a section on it in this week’s blog.
Who sets options pricing?
The stock exchange sets up the strikes and the expiry dates, but does NOT set the prices. That’s for traders. When they write an option, they are the ones who determine the price they are going to sell at. Of course, if they price them too high then no-one will buy them – or will they? The market makers, of course, are required to provide liquidity, does this affect the pricing?
Black-Scholes
The Black-Scholes model is known as an option pricing model,based on the strike, current price, time to expiration, risk free rate and volatility. But it has one major drawback for us: it is designed for European options that can only be exercised at expiration. It can be adjusted for American Options – there is a good calculator on Options Calculator – Barchart.com
DMM (Designated Market Makers)
I have been researching DMM (Designated Market Maker) rules, and I am FAR from an expert on them, but I will have a stab at explaining. The DMMs are there to provide liquidity in the market, and ensure that traders can buy and sell options. The DMMs have very specific rules about the spreads they have to offer, and the time they take to do that. Also in their rules is this (my highlights):
MMs improve price discovery at the open and close – NYSE’s opening and closing auctions are the largest single volume events of the trading day. DMMs contribute capital in the auctions to satisfy market demand, and provide human judgment and communication. Volatility is typically the highest during the first hour of trading as participants digest overnight news. DMMs help to establish the right opening price to minimize early-morning volatility.
In addition they must:
Quote certain percentage time at best prices (NBBO)
The NBBO (National Best Bid and Offer) is simply a quote that reports the highest bid price and lowest ask (offered) price in a security,
Are options really expensive?
We know from experience that SPY options aremore expensive. In previous years it was easy to buy an SPY option 1 year to expiry with a strike of 60% or more of the current price with an effective price (cost of the option + strike) less than 1% away.

Now we are looking at strikes of 50% and / or closer expiry dates. But is it just SPY options? No, it’s not. Funnily enough I came across some data that shows just that.
The forgotten book
As you would know, getting pricing from past options chains is impossible. While the intrinsic value is easy to calculate at any particular time, there is no record of the time value in past chains, unless you have taken a snapshot.
Last week, I was trying to catch up with things after my summer away, when I came across a book that I had written last year, and forgotten about. In it, I used AAPL (Apple) as an example to explain an options strategy. It was written in February last year, and on the 3rd February 22 when I took the snapshots of the options chain (intraday) AAPL was trading at $175.84.
I was curious: what was AAPL trading at now? I checked – and would you believe it was exactly the same: $175.84, 18 months later. I couldn’t believe my luck! I had comparable options chains. And – yes – options 1 year to expiry were more expensive now. To give an example:

So AAPL options were significantly (4 – 12%) more expensive now, including the DITM options. So AAPL is showing the same increase that we are seeing in SPY and QQQ.
Volatility
The usual explanation for high option prices is high volatility. Traders are willing to pay more for options where the underlying moves around more. But does this explanation check out? Here is the implied volatility for SPY since 2019. You can see that currently it is lower than it was in 2021, yet the options prices are higher.
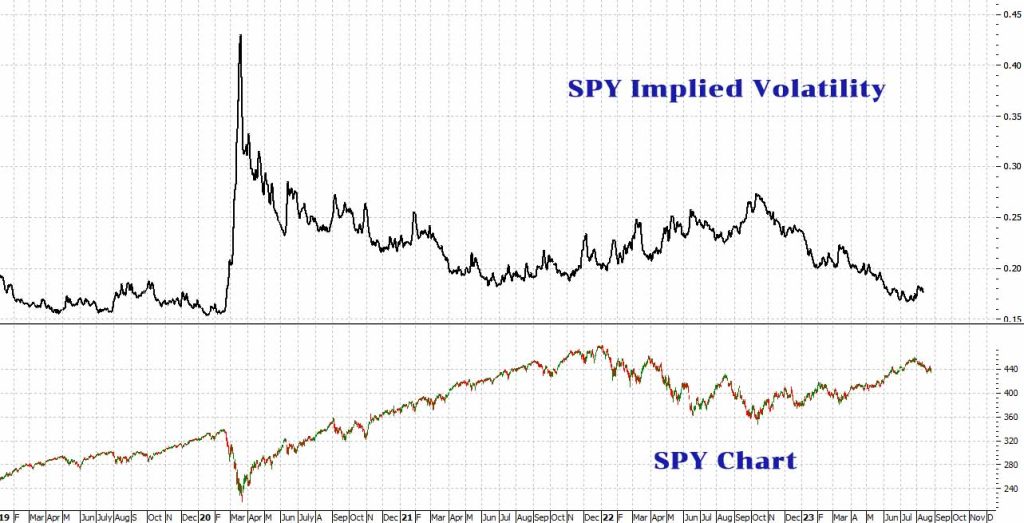
Go figure! As I said, I am not any sort of expert on options pricing models, I just work with what is there. If anyone can explain why options are more expensive now then I am very happy to listen and to publish any great explanations.
SPY Chart

Well, a white knuckle ride last week. Not enjoyable in the least. Three updays gave us a sense of optimism, which was slapped down very rudely on Thursday with a nasty red candle. Friday finished up, but the trading intraday went through a range almost as large as the day before. There is still no definitive direction, so this is a guess: probably we are in for some consolidation (sideways trading) before heading north again. Support at $430 hasn’t been broken, so that it a good sign. Fingers crossed.
SPYG Chart

Same pattern and comments as for SPY The support around $59 hasn’t been broken.
QQQ Chart
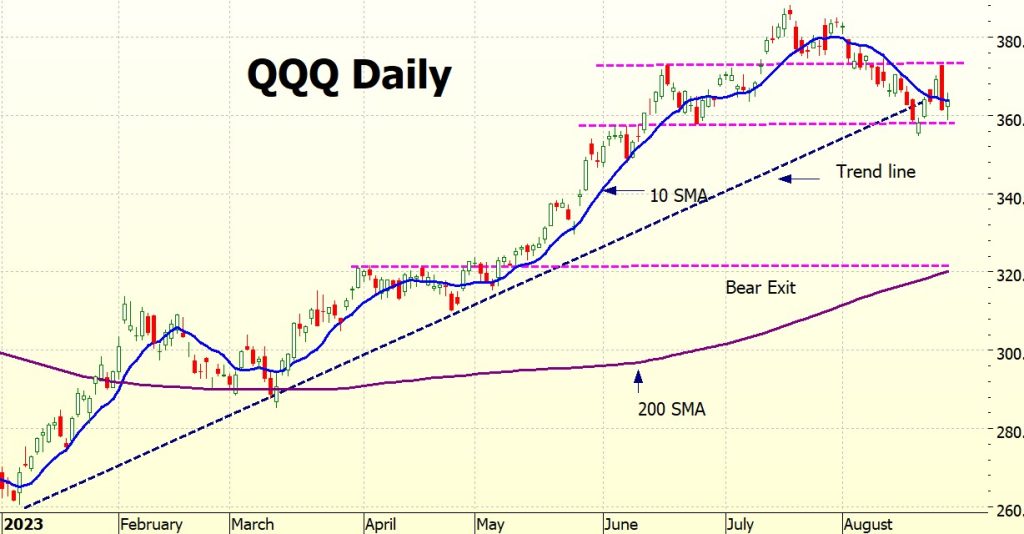
QQQ got the same bearish treatment last Thursday, and its recovery on Friday wasn’t quite as good as for SPY. You can see that it is trading between the support and resistance lines I have drawn – a break up above $374 would be bullish, if it dropped below $358 then it could retrace to $320. It has risen almost 40% this year, this would bring it back to a 21%, which is still quite a good increase.
VIX Chart

ITMeter

Daytrading Experiment
Not great; I started the week with $4,368.95 and ended with $4,446.03. To be fair, I only managed 3 days, and in one of them I was interrupted right in the middle of a trade. Not that it actually made much difference. But for around 5 hours work that is a pretty dismal return. Almost as bad as being an author!
His – Tom Hougaard’s – record is good, it just seems that the days that I am following him don’t seem to work out. I am also finding it very hard to be a follower. I have to continually restrain myself from branching out and doing my own thing. I will keep on trying – and if you want to follow him yourself, here’s his website: https://tradertom.com/.
Be careful: everything he does is free, but there are a few scammers who pretend that they are the real thing. If they ask for money, it isn’t really him.
Addendum:
A nasty sting in the tail.

Instead of getting out of the last position I stayed in with what I thought was a tight trailing stop. Obviously, I got it wrong and so didn’t get stopped out and instead lost another $150. Maybe the universe is trying to tell me I’m not cut out to be a day trader!

Futures
Well, the futures are up slightly, but it is way too early to tell. They bounce around a lot on Monday mornings. Last week it was all about Jackson Hole, and for a good commentary on it here’s a link to Scott Grannis.

Well, hoping for a good week, fingers crossed.
Heather
Photo by Jack O’Rourke on Unsplash
Related Posts
- The Bear Is Back
Back in a Bear Market. There’s no doubt about it; last night’s market drop has…
- Consolidation
Consolidation - Again! Well, SPY is going nowhere fast. We are in a consolidation period,…
- Covered Calls Revisited
While the bull market sleeps . . . Well, here we are, out of the…


31 Responses
Quick question: Why don’t you use SPX options for ITM strategies?
Hi Mark
SPX is an index, and doesn’t have options. SPY is an ETF that mirrors SPX, and it has options.
It is explained in Chapter 5 of the Bull book.
Hope this helps.
h
Heather,
“SPX” European-style settled options are available from my broker, TD Ameritrade. I have been trading them for ~5 years. I’m in the USA where SPX options are treated as section 1256 contracts which affords me two unique advantages: 60/40 taxation (long-term rate/short-term rate) plus the wash sale rule does not apply to them. Given that these “SPX” options are available to me, do you have any objections to using them?
~ Mark
Hi Mark,
European options have quite a different price movement from American options, so I don’t know how the ITM Strategy would work on that.
I guess if you are holding to near-expiry then it should be OK – but if we get an OUT signal you may have to sell at less than face value. I’m trying to remember everything I know about them – I traded Eurostoxx and AEX for several years, and the pricing used to annoy me, as often if I could have exercised I would have been way in front, but I could only sell the option at the current market price. Ive been holding both Eurostoxx and AEX for some years – (in 2017 I got options 7 years to expiry, so they are valid until 2024 – Saxo changed the rules after that now you can only go 2 years out)
In short, I don’t know how ITM is going to go on European-style options – sorry!
On September 14 at 5:30 am I was able to find the following prices to purchase SPY contracts on TD Ameritrade’s Think or Swim SPY price: 448.15, contract expiry September 20, 2024 (372 days):
Strike. Effective Price
225. 454
220. 453.9
215. 453.5
210. 453.2
195. 452.2
160. 449.99
Are others here finding the same results? I will be curious about what you think regarding the potential returns/losses with these effective prices. It seems that the increased premium reduces the leverage mentioned in the system. I am a newbie and just completed the Bull strategy book and am itchy to setup up my first DITM trade but am wondering whether this is a good time to do this? Is any time above the Golden Cross a green light to enter a DITM trade on the SPY? In other blogs on this sight, there has been mention of the SPY possibly falling during this time of year. Should one wait for the dip? Or just go for it as long as we are above the Golden Cross?
Darren
Congrats Heather! First time I have ever read a book about options I can understand and is usable for a retail investor. However, it is with much trepidation I would consider embarking on a SPY call strategy at this time. It has only worked because the US have printed money like crazy during the last decade and because interest was low. Perhaps a call stragy on TLT by sonetime next year?
Hi Clarence,
I know that there has been a lot of ‘money printing’ and money supply economics isn’t my area, but I recommend that for a discussion of this you try the website Scottgrannis.blogspot.com as he is across this and has the most informative articles and graphs.
I quote from his latest: Inflation didn’t start showing up until 2021, when Covid fears began to ease and the economy began to get back on its feet. Rising confidence meant that people no longer needed to hold tons of money in their bank accounts. Declining money demand at a time of abundant M2 unleashed a wave of inflation. It wasn’t until a year later—March ’22—that the Fed (very belatedly) took steps to bolster the demand for money by raising short-term interest rates. Sharply higher interest rates over the past 16 months have had their intended effect: the public has become much more willing to hold on to the huge excess of M2, even as excess M2 has been declining. Falling inflation is the result. Money supply and money demand have moved back into rough balance.
His graph of M2 Money supply highlights what he is talking about so I would read check it out.
Re TLT – again, not really my area (for those of you who are not familiar with TLT it is an ETF of Long term Treasury (20+ years) bonds). I played with them for a while after the GFC, and did very badly, so I haven’t been back. Remember ‘interest rates can’t stay this low for very long’? Well, they stayed a lot longer than I thought and I got burned, so I have kept away from them since. But that doesn’t mean you should, just that I am the wrong person to advise on them.
I wouldn’t give up on the stock market rising any more just yet!
h
What would be the downside to choosing SPY option with 143 days to expiry (Jan 19, 2024) if the effective price is less than 1% away? I would just have to roll or close sooner than a longer expiry?
Hi Jason – the only downside is that you would have to roll in December 2024 – which isn’t really a problem, you just have tpo remember to do it.
h
AAAARRRGGGGGHHHH! Just been told I got that wrong – ooops – correction: I meant December 2023.
Sorry!!
Hi Heather. In your recent blog, you asked the question “Why are options expensive?”
I’m not an expert in option pricing either, but it is my understanding that the price of a call increases if interest rates rise. That may not be the entire reason for the increased cost that you pointed out, but it is probably a significant factor. Interest rates were so low for so long that it was easy to ignore interest as a factor in the price of options. The large increase in short term interest rates over the last year or so means we now have to take interest rates into account.
Best regards,
Phil K
Hi Phil – absolutely right! Just been testing it on a Black-SCholes options pricing calculator (see above) and it accounts for a large part of the increase in costs.
Thanks!
h
Query from Darren:
Heather, I love your book – the bull strategy. Reading now about the crosses and the choice to stay in or close positions. I would like to start the DITM strategy but am unclear whether we are in bull or bear territory now. If I zoom out on the SPY chart 5 years or longer, it looks like we are continuing on an uptrend. I did get all three of your books. The DITM strategy is the first strategy I can wrap my head around.
HI Darren, right now ITM is in a bull trade – the golden cross was Jan 24th this year, so that was our signal to get into a bull trade. The signal is still in force, until we get a death cross – and hopefully not soon!
h
From Eric – Publishing here as I think everyone will find it interesting:
Hi Heather, I enjoyed your recent message concerning option prices. I wanted to make you aware of a tool I use frequently. It’s called think Back and it is part of the Think or Swim Desktop trading platform by TD Ameritrade. It’s a time machine! You can find it under the Analyze tab. It allows you to enter a stock symbol & select the number of expiration dates to display. Then you set a date in the past. It will display the option chain with the selected number of expirations on that date. Once you select the expiration date and a strike price it will display that option contract’s data including the Bid and Ask prices (and Greeks among other things) on that date in the past. Then the fun really begins. You can then enter the number of contracts bought or sold. The it allows you to adjust the P/L Date to a future date and it will show you the profit or loss on the trade. It also displays the option profit and loss curve overlayed on the stock chart at the bottom of the screen. You can sign up for a free paper trading account with the Think or Swim Desktop trading platform and take it for a test drive with $100K of paper money. I hope you find this information useful! https://www.tdameritrade.com/tools-and-platforms/thinkorswim/desktop.html Thanks for all you do! Sincerely, Eric, Lake Mary, Florida
HI Eric – thank you – have published this so that everyone can see it, and I’m off to check it out. It will be terribly handy!
h
Actually call options would increase in price in a rising interest rate environment, but put options actually become cheaper.
Go figure.
Hi – the black scholes option calculator I am using does not differentiate between calls and puts – apparently it is assuming that everything is symmetrical. That was: https://goodcalculators.com/black-scholes-calculator/ and is for European options.
I’ve found another calculator, https://accuratecalculators.com/options-calculator which does American options, and using the parameters below(SPY $440, strike $220, 1 year to expiry, American option) and only varying the interest rate I get a a 2.7% difference in options pricing when I move the interest rate from 2% to 4.75%.
So it seems we have solved a large part of the mystery!
Thank you!
h
Hi Heather,
I’m no expert on options pricing, but I think Rho (one of the Greeks) could explain at least part of the increase in prices.
Rho correlates with the return on risk free investments. Since short-term rates have gone up significantly in the last year with all the Fed rate hikes, the value of Rho and therefore the value of options should increase.
Don’t ask me to do the calculation, but I’m pretty sure that’s at least part of the explanation for increased prices on options.
Al V.
Hi Al, thank you for this and yes you are right in that rho accounts for at least part of the variation.
Using a Black scholes calculator the difference between a zero risk-free interest rate and a 5% interest rate causes a 4.5% increase in the option price. (SPY, current $$), strike 220, volatility 15%)
So thats a big part of the mystery solved – thank you!
h
Good morning Heather,
As always, thank you for your weekly thoughts and updates of the stock market. I learn so much from reading it. Regarding your day trading account of $5k, there is a simple trading strategy. In the final 5 minutes of the trading section from 12:55pm to 12:59pm New York Time, we can buy 1 share of SPY or 1 contract of SPY call or 1 contract of SPY call debit spread and hold it overnight and in the first 5 minutes of the trading section from 6:30am to 6:34am New York Time, we can close the position. This simple trading works because institutional investors usually invest workers’ money in the SPY in the first few minutes of the market opening causing the SPY to increase temporarily.
Sincerely,
George Halongton of Los Angeles
Hey George – fascinating! Let me check it out!
h
Hi George,
I would like to know more of your buy and hold overnight strategy. How do you know whether to buy a call or debit spread?
HI George – see quetion above from Charity – I am sure that others will be interested in your answer too!
h
Good morning, Charity 🙂
Good morning, Heather 🙂
Good morning, Others 🙂
Thank you for asking a great question. It is a matter of personal preference. To buy SPY shares or to buy a SPY call or to buy a SPY call debit spread is similar depending on each person’s risk tolerance. Buying a SPY call debit spread at $1 wide of strike prices requires around $50 more or less but it requires options level 3 to do spreads.
Sincerely,
George Halongton of Los Angeles
Thank you George – and, yes, it is a nuisance about level 3. I have it in my personal accounts but they wont let me do them in my accounts owned by my retirement fund.
‘Too dangerous’!
Go figure!
h
Good morning Heather,
We can just buy one share of SPY or one contract of SPY call in the last few minutes of the trading day and close it in the first few minutes of the next trading day. Please give it a try. The biggest hassle of this type of trading is we have to wait until the last few minutes of the previous trading day to open the position and then wait until the first few minutes of the next trading day to close the position. Then we have at least 6 hours to do something else like gardening and cooking instead of trading.
Sincerely,
George Halongton
HI George – going to try it – but it involves me getting up at 4AM (I’m in Australia) – however, I will do it.
(How’s that for dedication?!)
Hi,
Did you mean the final 5 minutes before closing? Because if so, that would be 3:55pm to 4:00pm Eastern Time. I’m confused about 12:55pm to 12:59pm as that would leave 3 hours left before the closing bell. Did you mean 12:55 to 12:59 PT?
Kevin Cation
Hi Kevin – now I am confused. Where did the 12:55 to 12:59 come from?
I assumed that George meant 3:55 – 4PM Ney York Time.
George – can you clarify?
h
Hi Heather- I was thinking that since George says he is in Los Angeles market closing time there would be 1pm. He followed the 12:55 to 12:59 with “New York Time” which threw me off. Closing time for LA would be 1, in Colorado which is Mountain Time would be 2, Midwest would be 3 and East Coast is 4.
Kevin