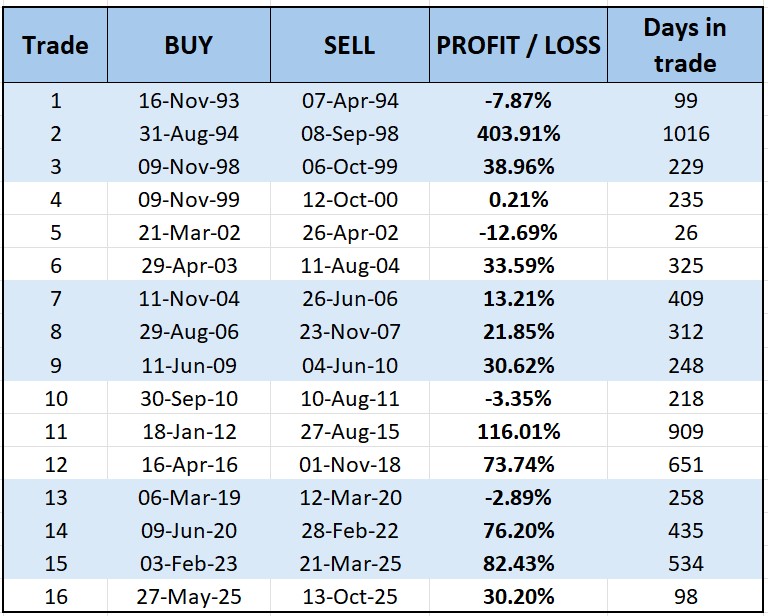
These are the exact trades generated by the ITM rules on SPY from 1993 – 2025.
Bull Market Results Summary - SPY
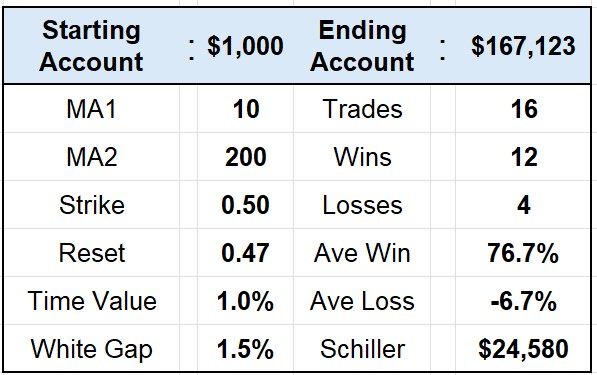
The SPY backtest covers multiple full market cycles and applies the same entry and exit rules throughout the test period.
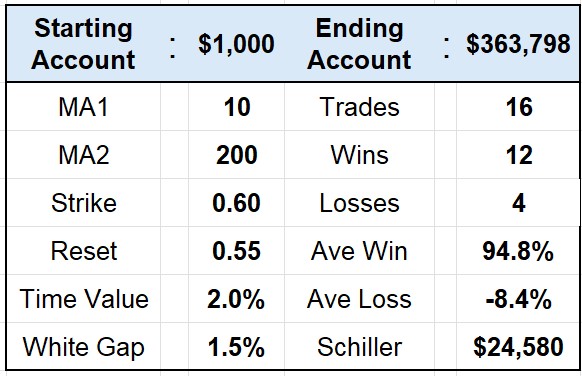
Results are shown for both the 50% and 60% in-the-money variants of the ITM strategy, allowing comparison of behaviour under identical market conditions.
Results Summary - SPY 50% Strike
Results Summary - SPY 60% Strike
Trade List - SPY
The following trade lists show all SPY positions generated by the ITM rules 1993 – 2025
NOTE: The trade dates shown are identical for both the 50% and 60% in-the-money variants of the ITM strategy; only the option strike selection differs.
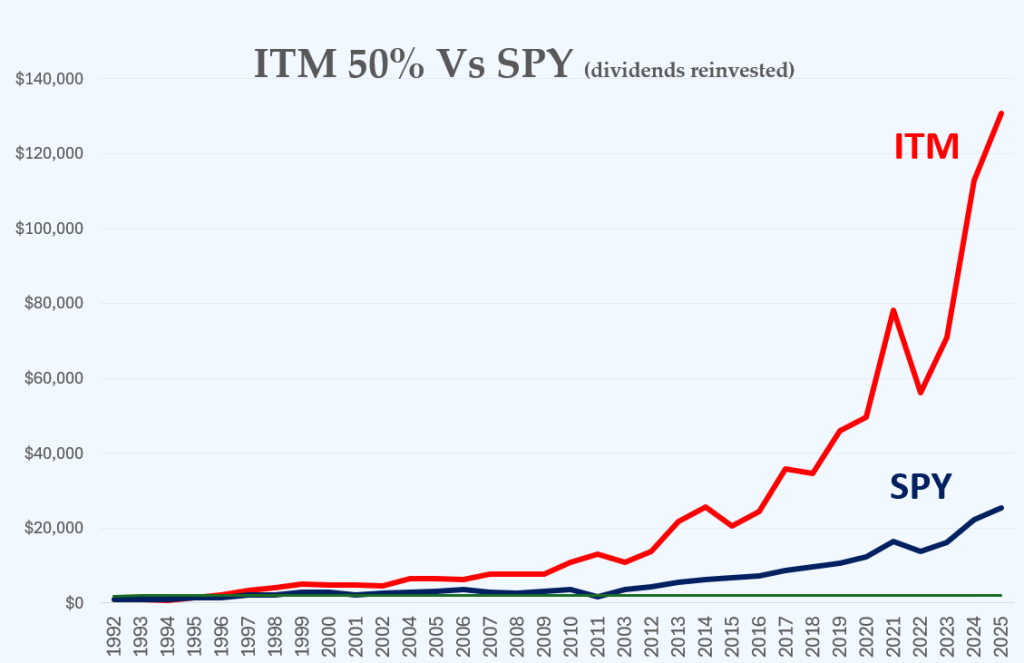
Performance Graphs - SPY
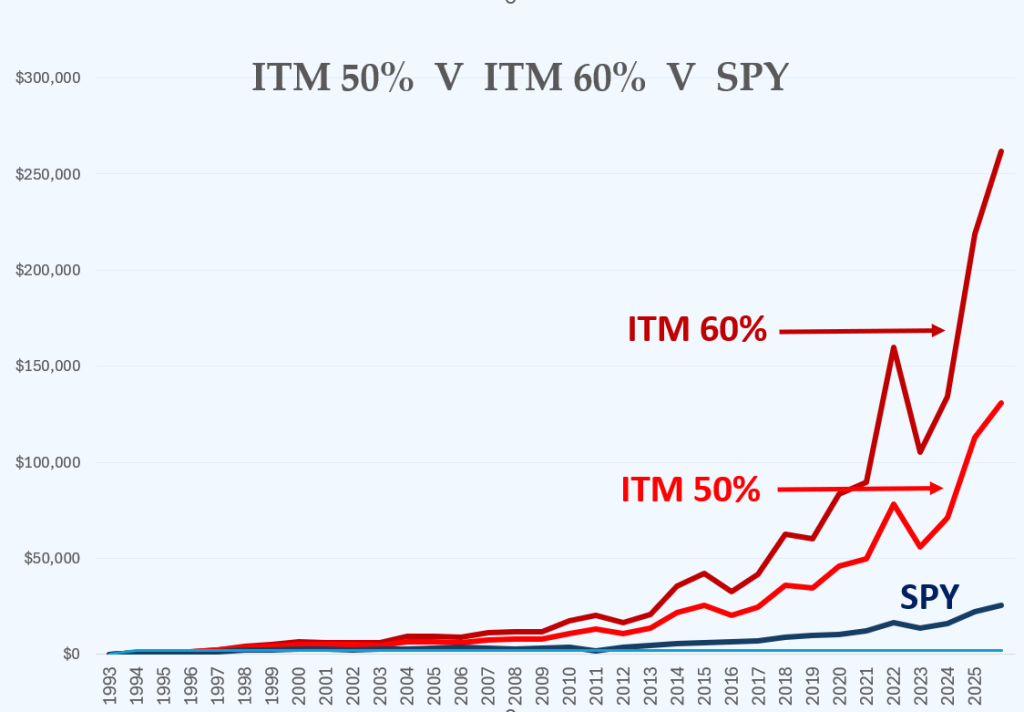
The graphs below show the cumulative performance of the ITM strategy applied to SPY 1993 – 2025
SPY Shares Performance 1993-2025
Comparison ITM 50% Strike Vs SPY
Comparison ITM 50% & ITM 60% Strikes Vs SPY
Summary Notes - SPY
All SPY results shown on this page are generated from the same underlying trade signals and timing. Differences between the 50% and 60% in-the-money variants arise from option structure rather than trade selection. Full methodology and assumptions are on the main Backtesting page.
Thank you – your message has been sent.
You will be notified when there is a new blog post.
Please note that Heather answers all questions at the end of the ITM Blog.
Happy trading!
We noticed you're visiting from United States (US). We've updated our prices to United States (US) dollar for your shopping convenience. Use Australian dollar instead.Dismiss