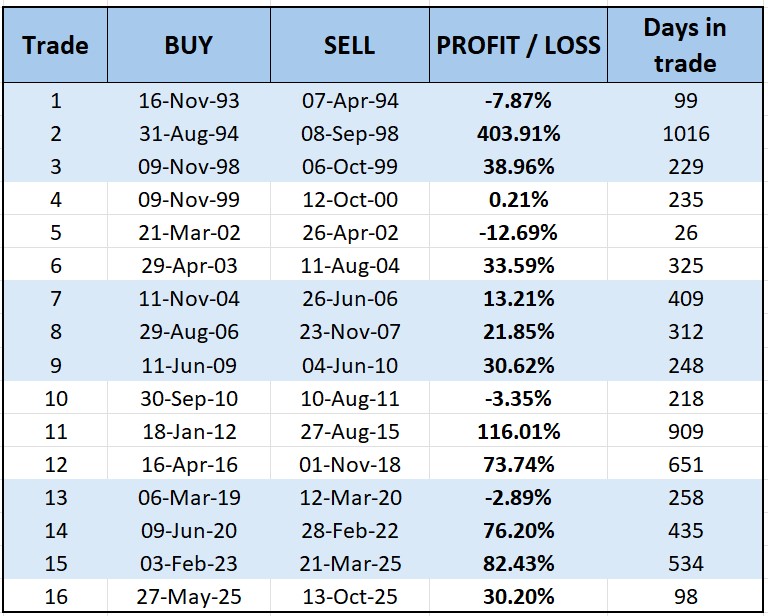
These are the exact trades generated by the ITM rules on SPY from 1993 – 2025.
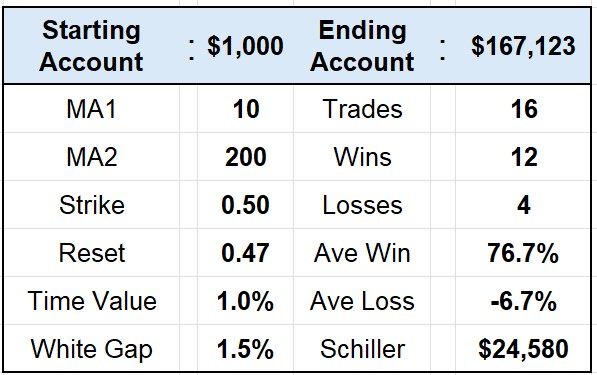
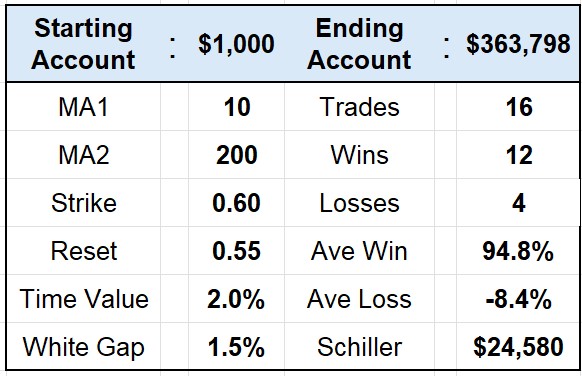
Bull Market Results Summary - SPY
The SPY backtest covers multiple full market cycles and applies the same entry and exit rules throughout the test period.
Results are shown for both the 50% and 60% in-the-money variants of the ITM strategy, allowing comparison of behaviour under identical market conditions.
Results Summary - SPY 50% Strike
Results Summary - SPY 60% Strike
Trade List - SPY
The following trade lists show all SPY positions generated by the ITM rules 1993 – 2025
NOTE: The trade dates shown are identical for both the 50% and 60% in-the-money variants of the ITM strategy; only the option strike selection differs.
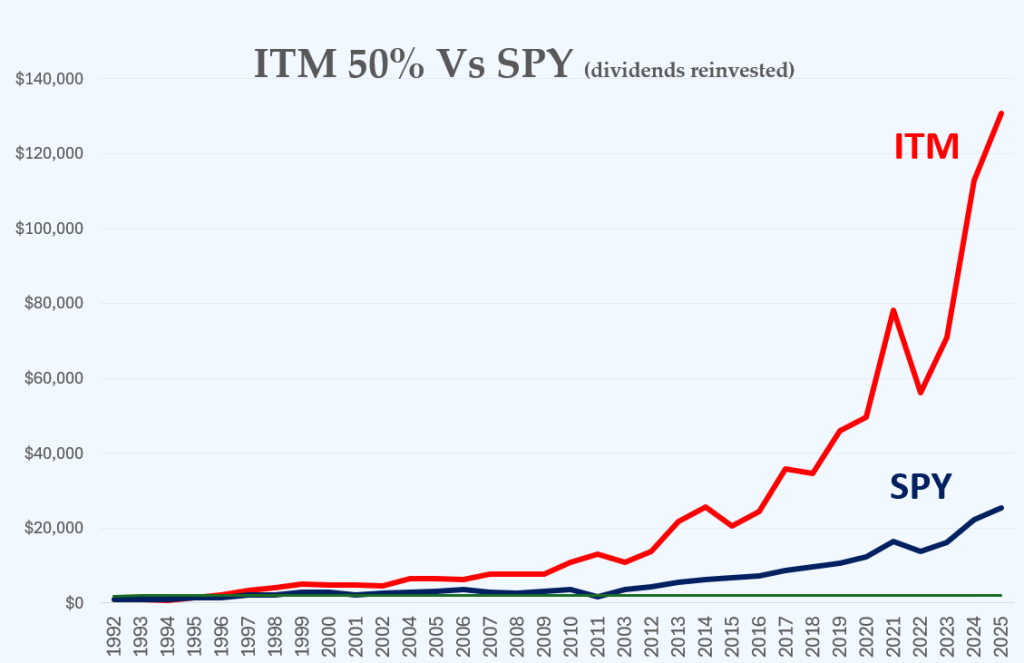
Performance Graphs - SPY
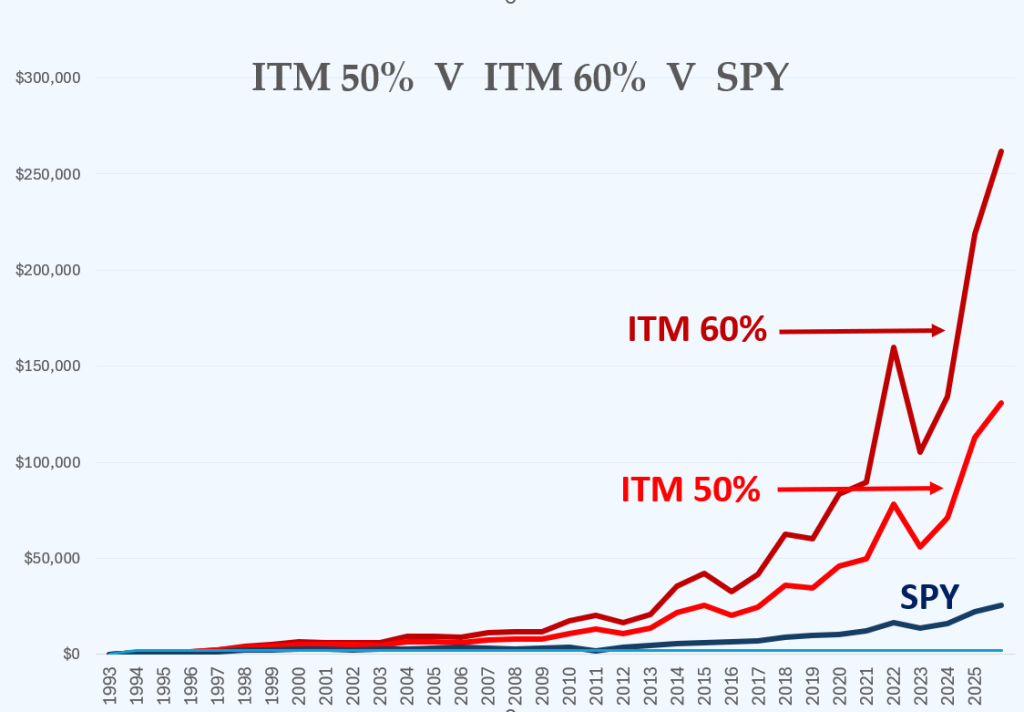
The graphs below show the cumulative performance of the ITM strategy applied to SPY 1993 – 2025
SPY Shares Performance 1993-2025
Comparison ITM 50% Strike Vs SPY
Comparison ITM 50% & ITM 60% Strikes Vs SPY
Summary Notes - SPY
All SPY results shown on this page are generated from the same underlying trade signals and timing. Differences between the 50% and 60% in-the-money variants arise from option structure rather than trade selection. Full methodology and assumptions are on the main Backtesting page.
Thank you – your message has been sent.
You will be notified when there is a new blog post.
Please note that Heather answers all questions at the end of the ITM Blog.