


YOLO Trading Strategy.
Travelling through different countries, observing the different national characteristics, started me thinking: Do different countries use different trading strategies? And if so, how do they compare with each other?
Trading in Australia
Actually, no-one ‘trades’ in Australia – it’s a dirty word. They are all ‘Investors’. From my observations, there are 2 types of investors:
- Speculation. They know the next ‘Poseidon’ – some obscure mining company that will make a fantastic discovery and the shares will soar into the stratosphere.
- Income Investing. ‘Blue chip’ dividend investment and franking credits. Let me explain.

Dividends in Australia far exceed those in other countries. The ASX 200 has an average dividend of 2.79%, with a franking credit yield of 0.85%. In the U.S. it is 1.23% – less than one third.
Franking credits mean the company has already paid tax on profits, so the shareholder gets a ‘tax credit’ they can put against their personal tax liability or (in some cases) as cash.
Let’s all move to Australia!
Just before you do, have a look at how limited the stock market is. There are few companies, and very little choice.
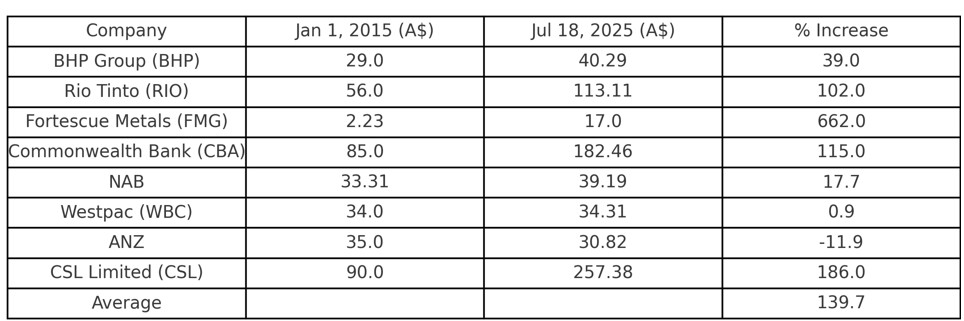
The Australian market is dominated by the 3 big miners, 4 big banks and CSL (pharmaceuticals) which account for 55% of the ASX 200 index.
If you add in the next 5 biggest stocks it is 72% of the index. 8 stocks and 72% of the index?
Definitely not much choice.
It gets worse
Since the bottom of the GFC, the US market has increased by 831%, the Australian market by 178%. Bit of a difference, yes?
You can’t have everything. If companies prefer to hand out their profits as dividends, then there is less available to develop and grow the company. This can be seen by looking at the major companies share prices over the last 10 years:
Compare this with the top 10 companies in the S&P 500:
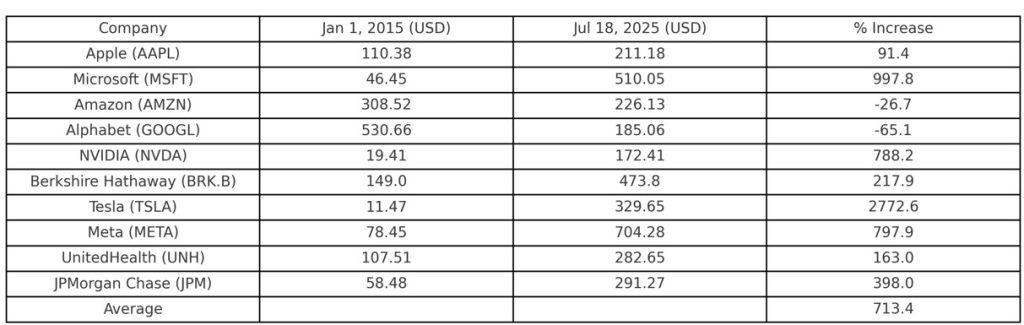
So if you invested $1,000 on Jan 1 2015 you results would be:
Australia: $2,730
U.S. $8,130
What would you prefer?
Well, strangely, Australians prefer their franking credits to capital growth.
I published an Australian version of In The Money: Bull Market Strategy, which alerted readers to the disadvantages of trading the local market, and showed them how to trade the U.S. market from Australia.

It sold dismally – only a couple of hundred copies. Clearly, no-one was interested so I unpublished it.
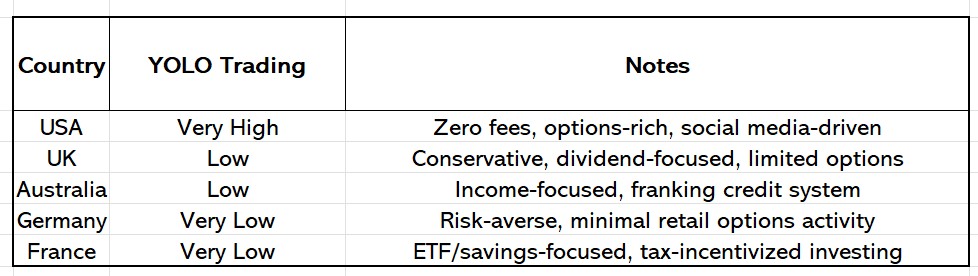
What about YOLO?

The acronym was new to me too:
You Only Live Once.
YOLO trading refers to a high-risk trading style where a trader puts a large portion – or even all – of their capital into a single, speculative trade, usually in the hopes of a massive short-term payoff.
YOLO trading is a distinctly American phenomenon, fueled by structural, cultural, and technological factors – in other words, social media and commission free trading!
I had intended to go through YOLO and the different country’s trading strategies, but this blog is already long enough. I will revisit next week. Probably.
Amazon’s Brain Snap
I was alerted by a reader (thank you Gareth) that he couldn’t find my books on Amazon. News to me! So I searched Amazon, to discover that I had been cancelled. I was a non-person. I could not even log into my account! I searched through my emails and found this:
Hello,
We were unable to verify your identity. As a result, your account has been terminated.
As part of the termination process:
- We will close your account.
- You’re no longer eligible to receive outstanding royalties.
- You’ll no longer have access to your account, meaning you will be unable to edit your titles, view your reports, or access any other information within your account.
- All your published titles will be removed from sale on Amazon.
Additionally, as per our Terms and Conditions, you aren’t allowed to open any new KDP accounts.
You can find our Terms and Conditions here: https://kdp.amazon.com/terms-and-conditions
If you believe this decision was an error, please share all relevant information for us to review and reply to this message.
Amazon KDP
Really friendly, huh? Without much hope, I emailed them pointing out that it was strange that they could not identify me as I had been one of their authors for almost 5 years, and had sold tens of thousands of books. Then I humphed off for a walk around Oslo, fuming.
I was alerted later (thank you again Gareth!) that they were back. No notification from Amazon and not a word of apology. Which made me realize that I was just as much subject to the whims of Amazon, as I was previously to google and the ATO (Australian Tax Office).
So, something has to change. I am still working out what.
To the markets
Quite a good week – after the heart-stopping drop on Wednesday (which was quickly reversed). The S&P 500 closed slightly lower on Friday, July 18, at 6,296.79, after reaching a record high the previous day. The Nasdaq Composite edged up to a new record of 20,895.66, marking its 11th record high of the year. Year-to-date, the Nasdaq has gained 8.2%, the S&P 500 is up 7.1%.
Let’s check the charts:
SPY Charts
SPY is looking good, still with above average volume so the bull is not running out of steam. The small candles show that trading is orderly, with no wild swings – except for Wednesday, of course. Let’s look at that more closely.
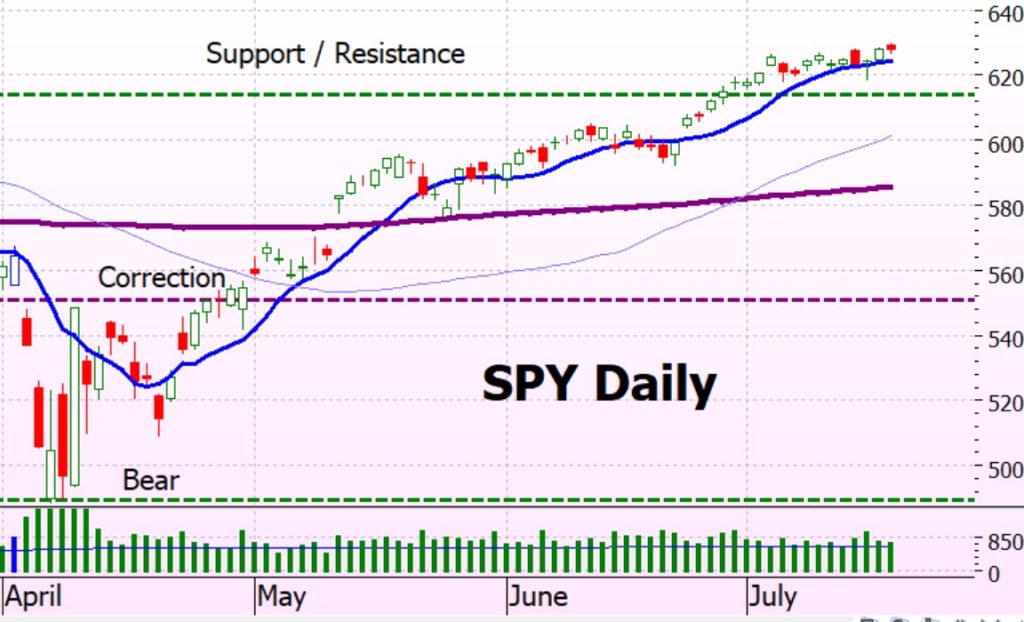
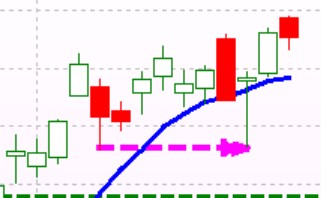
The dragonfly doji on Wednesday came down to the low reached on the 7th July (pink dashed arrow), then rebounded ending the day just higher than the open. The bears were in charge for a while, but the bulls decided enough was enough at the previous low and drove the price back up again. The day after was a nice green candle.
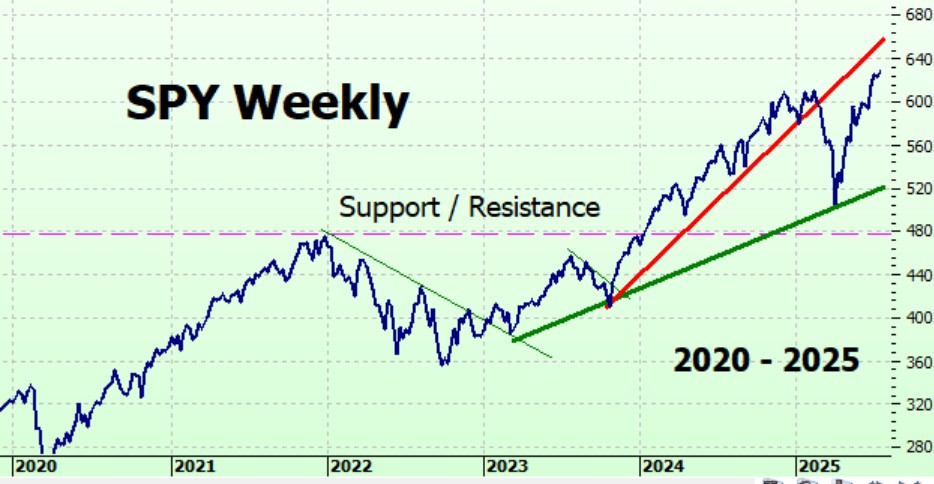
On the longer term chart we see that SPY is still bouncing upwards, but has not yet crossed the uptrend starting in late 2023 (red line).
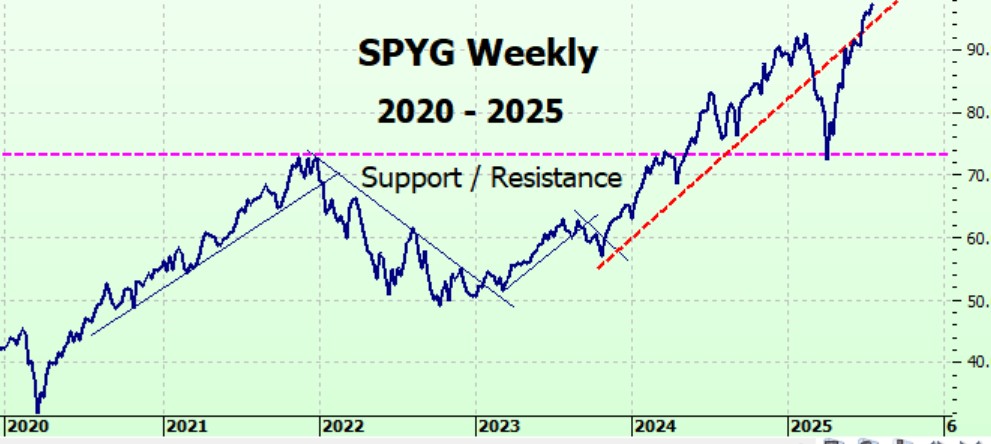
SPYG Charts
SPYG is showing the same pattern as SPY – uptrend intact, small candles showing no euphoria / extreme pessimism. If you are wondering why I don’t show and / or comment on the volume for SPYG it is because being a lesser-traded ETF the volume doesn’t actually mean anything. Its best to look at the volume for SPY, or QQQ, to get an idea of the trading volumes.
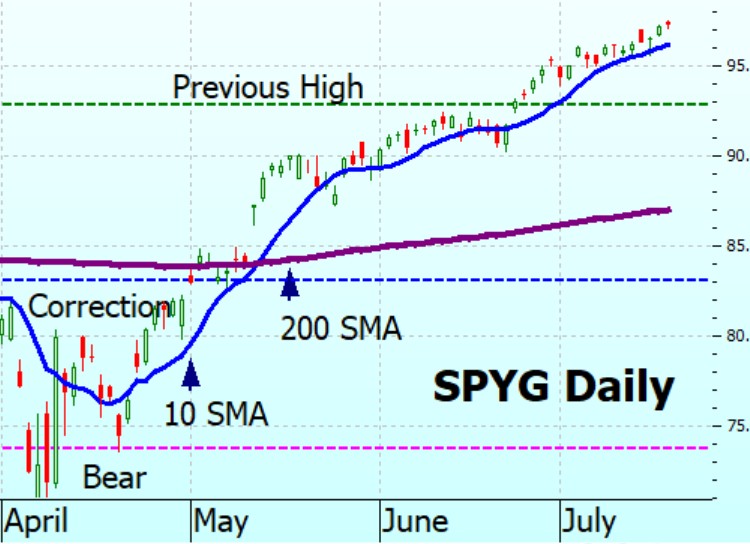
On the long term chart, we see that it is back to the uptrend that started late 2023.
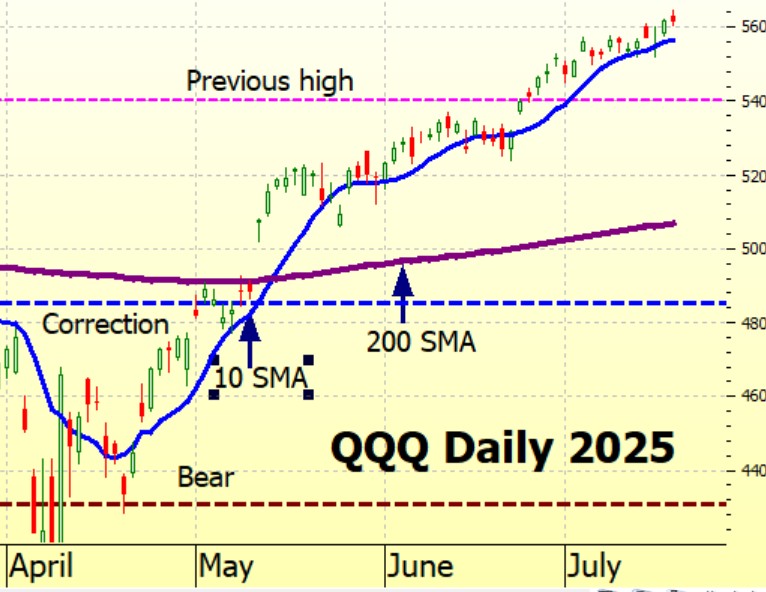
QQQ Charts
What a nice chart! Going up gently and steadily.
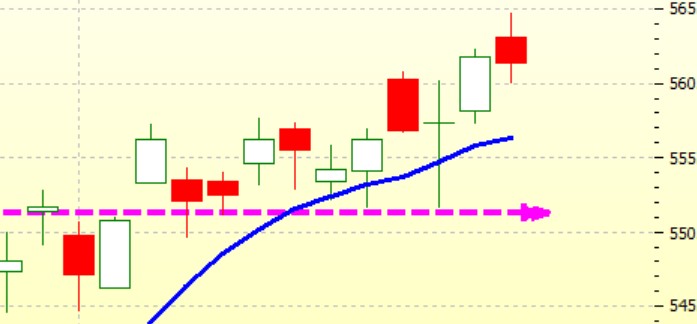
Just as a point of interest – look at the close up of the last couple of weeks. Like SPY, on Wednesday there was a doji – the bears drove the price down, the bulls drove it right back up again to the open – and formed a perfect doji.
Unusual to see such a text book example. But it also goes to show that a doji by itself does not mean anything when it comes to trend reversal. That’s why you should never act on a doji alone – wait for it to be confirmed by the next couple of day’s trading otherwise you may be acting on a false signal.
Not that it bothers us when trading ITM – this is just for interest as you will probably have read elsewhere about the significance of the doji in signalling trend reversals.
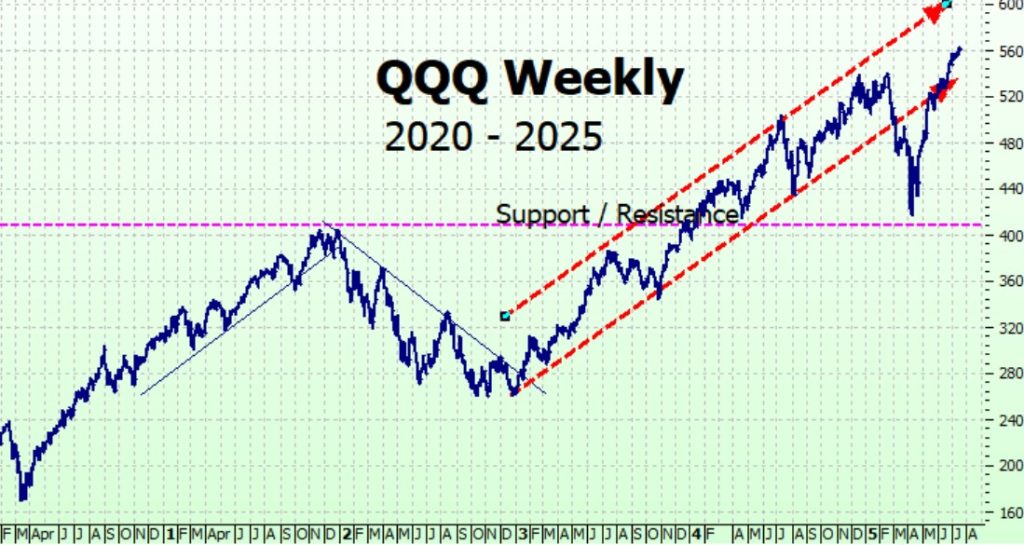
On the long term chart we see that QQQ is back in its trading channel.
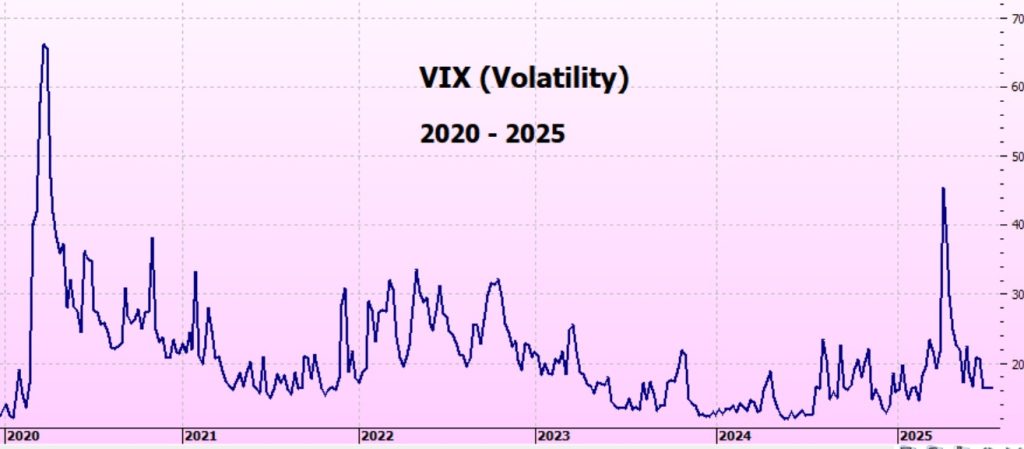
VIX Chart
The VIX is back below 20 – low volatility territory.
ITMeter

The week ahead
The Earnings Season is well underway, with 12% of S&P 500 companies already reporting second-quarter earnings. 83% surpassed EPS (earnings per share) estimates. This week, over 100 major companies are scheduled to report, including Alphabet, Tesla, IBM, and Intel.
Trade tensions continue as the U.S. prepares to implement 25% tariffs on a range of EU imports starting August 1. What will happen? No idea, but it makes the market a bit edgy.
Federal Reserve Chair Jerome Powell is talking again. He is scheduled to speak on bank regulation, providing potential insights into monetary policy ahead of the July 29–30 FOMC meeting. Existing Home Sales for June and Jobless Claims are out on Thursday.
The Futures
Up slighty, but still some hours to market open.
This week's blog coming from . .
Norway. Beautiful. Fiords and islands everywhere.
Yes, the hole in the mountain is natural!


Below is North Cape – this most northern point in mainland Europe

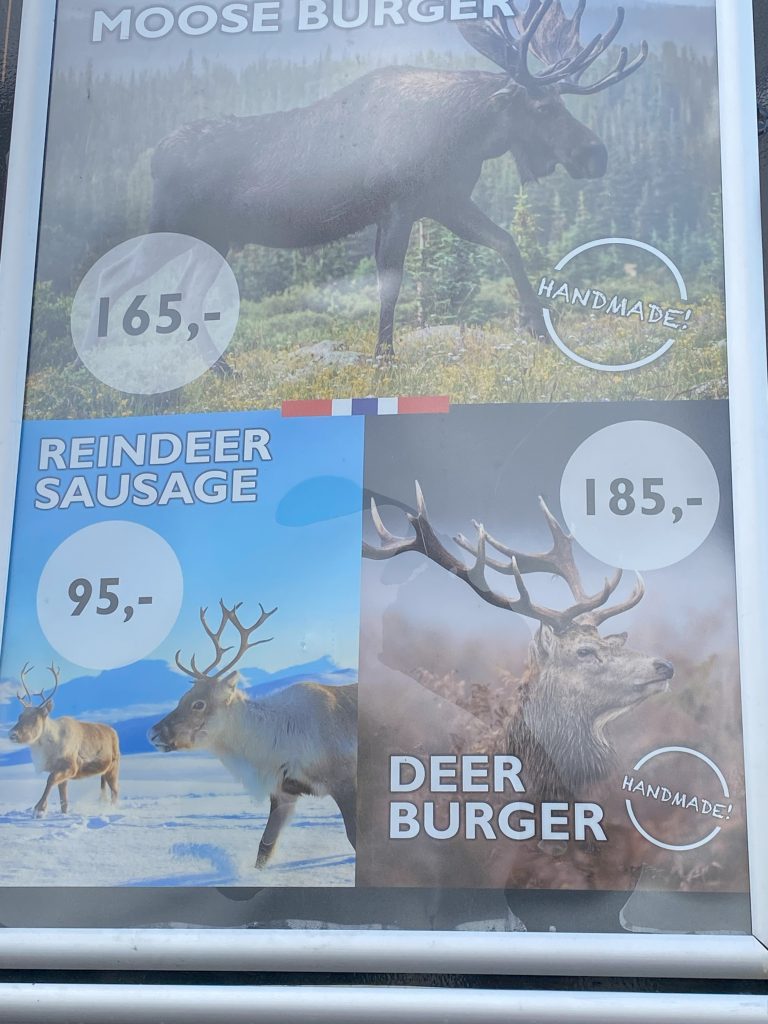
But can’t quite get used to the delicacies!

Fingers crossed for a good week!
Heather
Trade the tide, not the waves
Q & A
Related Posts
- Trading The Bear!
In The Money: Bear Trading Strategy The new book in the In The Money series…
- Trading & Emotions
Trading and Emotions. Last week was a bit of a roller coaster – well, to…
- Trading the Bear Market
So the Bear Won! There’s no doubt about it: we are in a bear market.…


21 Responses
I’m curious why the EMA(30)/EMA(70) and EMA(10)/EMA(20) crossover strategy performs better than the SMA 10/200 Crossover over the same period. Is this strategy useful if trading in a IRA account instead of a brokerage account so you’re not impacted by capital gains?
https://backalpha.com/strategies/crossover/spy/buy-ema30-above-ema70-percent1.0/sell-ema10-below-ema20-percent1.5/riskfree4.0/leverage4.0-timedecay4.0
HI Jason
I am still on holiday so havent access to my PC and backtesting – just this silly little laptop!
I will certainly check out your links when I get back in a couple of weeks – but just to let you know, I backtest going all the way back to 1993, and there will definitely be shorter periods where other parameters win, but overall I haven’t found anything better than the 10/200 SMA.
Which isn’t to say there isn’t a better combination – i will check tou you suggestions when I am back.
Thanks!
h
Hi Jason,
I’m curious, how did they receive 4x leverage. Was it by buying Calls that were 25% in the money and if so how far from expiry were they. Also what was the purchase price used, that is, was it ask, bid or mid, for both buying and selling? If I missed something in the link please let me know.
Also I wonder how this would compare to using Heather”s 10/200 SMA if used with 4X leverage.
Thanks, Jim
Hi – I can add some info here – if you used the 10/200 SMA with 4X leverage you get wiped ou quite early on. To volatile, doesn’t give you any staying power.
60% strike is really the hoghest leverage that isnt dangerous.
h
Jason,
The last I knew you are not allowed to buy options in an IRA. You can sell covered calls and write cash secured puts but that is it as far as options go.
Things could have changed but I doubt it. You can check with your broker.
Jim
Jim,
May be your broker? I trade options in my IRA with Fidelity. I think you have to go through a process to get permission. Basically just to assure them that you are at least somewhat knowledgeable about trading options.
I’d like to share some thoughts here, since I’ve spent a lot of time researching and backtesting the EMA strategy featured on BackAlpha.com.
First, regarding IRAs: Whether you use an EMA or SMA strategy, your tax treatment will be similar. So, choosing between these strategies shouldn’t depend on whether you’re investing inside an IRA account or not.
Personally, I prefer the EMA strategy. It’s backed by robust historical data—having been backtested over the entire SPY dataset—and the performance has been excellent. While 4x leverage might sound risky, the historical backtest never resulted in a wipeout, likely because the strategy includes clear exit signals. The key is to exit before a catastrophic loss occurs.
As for leverage, 4x leverage means you’re buying call options at a premium equal to 25% of the stock price. For example, if SPY is $640, you could buy call options at $160 per share, allowing you to control the same amount of shares with just 25% of the capital.
However, there’s another way to look at leverage. Let’s say you have $64,000. You could buy 100 shares of SPY (delta = 1.0), or, with $160 call options, you could buy 4 contracts (controlling 400 shares). But options rarely have a delta of exactly 1.0—in this example, let’s assume a delta of 0.85. Your actual exposure would then be 0.85 × 400 = 340 shares, so your effective leverage is 340/100 = 3.4x.
In summary: The effective leverage used on BackAlpha.com is usually a bit lower than the “headline” 4x number shown on the site, mainly because of the option delta.
Hope this helps clarify things!
Hey Tyler – thank you for the time you are putting into this – I am afraid that being on holiday means that I haven’t backtested this for myself. When I get back i most definitely will!
h
Dear Heather,
Thank you for your weekly posts as always. If I can, I will nominate you along with Catherine Wood of ARK Invest. Both of you are like Warren Buffett and Charles Munger of Berkshire Hathaway whom I deeply respect and admire.
Sincerely,
George Henry
In 2014, after her idea for actively managed exchange-traded funds (ETFs) based on disruptive innovation was deemed too risky by AllianceBernstein, Cathie Wood left the company and founded ARK Invest.[8][3][13][14] The company is named after the Ark of the Covenant; Wood was reading the One-Year Bible at the time.[15] ARK’s first four ETFs were seeded with capital from Bill Hwang of Archegos Capital.[16]
Hey George – I didn’t know about Cathie Woods – did a quick google and she looks interesting, will check her out more thoroughly when I have a stable interenet connection.
Thank you!
h
Hi Heather, I noticed a time or two that you’ve mentioned Darvas boxes. If you have written about Darvas boxes, can you please direct me to find them. I enjoy and learn every week on your comments. Thanks for the helpful info. Michael
Hi Michael – thank you!
Re Darvas boxes – good question. I have probably puzzled a few people, as I don’t mention them in the books – so I’ll do next week’s blog on them.
Hope that will help.
h
Hi Heather,
Thank you for your great blog posts, and apologies for not answering your question earlier — yes, we had contact last year .
I placed my first SPYG option order on May 23, 2025 — a Dec 19 ’25 55 Call. I made the rookie mistake of buying at market and not converting my EUR to USD beforehand… not sure how much that ended up costing me. The position is currently showing an unrealized gain of +$936.82.
Now I’m ready to place my next trade. I’m considering two options and wondering which would be the better choice?:
Dec 19 ’25 55 Call for $43.66 (ITM 56%), or
Mar 20 ’26 60 Call for $39.44 (ITM 61%).
Also, how important is it to convert EUR to USD before placing the option order in terms of minimizing fees? Do you use your broker’s standard currency conversion, or do you go through Forex separately?
Thank you so much for taking the time to answer even beginner questions like mine!
Warm regards,
Marijana
PS: In one of your books or blog posts, you mentioned that you invested in the European market for a while. Given the current economic climate — and the fact that many Europeans tend to be cautious and value diversification — I’d love to hear what interesting strategies you’ve seen work well in the European market from your experience.
Also, in your book (chapter Turbocharge Your Results), you describe “side flutter” strategies to keep your money working until you can afford your next option (e.g. buying shares in SPY or using the ITMS strategy). In that chapter using spare funds to buy OTM options is mentioned (4–6 months to expiry, about 5% above the current market price). Could you expand a bit on how exactly this strategy works in practice?
Lastly, I was wondering: is writing OTM options to collect premiums also considered a side flutter strategy to boost returns — or would you say it’s more comparable to the not so nice dividend strategy? Both (buy and write OTM options) were briefly mentioned in the books, but I’m still trying to understand the key mechanics and differences behind them.
Dec 19 ’25 55 Call for $43.66 (ITM 56%), or
Mar 20 ’26 60 Call for $39.44 (ITM 61
I have just had a look at the pricing (which has varied since you asked, sorry) an%).d it seems to me that the Mar 20, 2026 options are the better value – not priced much differently to the Dec ones. AS you will know, the 55 is less risky, but probably less profitable – that’s a decision you have to make for yourself.
Also, how important is it to convert EUR to USD before placing the option order in terms of minimizing fees? Do you use your broker’s standard currency conversion, or do you go through Forex separately?
I do all my trading in USD, and only change currency when I am taking money out of the account (for holidays, etc!) and I use OFX who I have found to be very efficient, and slightly better rates than banks
Re the European market – I am completely out of it now, I still have some accounts open but not using them. The best trades I had were mentioned in the books – there are incredibly long-dated options on AEX that went out more than 7 years. I bought some of them, but then my account was restricted so I couldn’t buy them any more – but they worked out really well (if you are patient).
OTM trades? Really, it is a flutter, be prepared to lose it all which is why I say no more than 5% of your total. SPYG is not really suitable for this, as the spreads are too high. You could look at SPY Jan 2025, strike $660, but that will cost around $1,700 right now. I think it is a strategy when you have a larger account.
Writing OTM options? Writing naked is too dangerous – and you probably wouldn’t be allowed to do it on your account. You could do it as a cash-secured put, but this means that you have to have enough cash in your account in case you are exercised – which means you need to hold a lot of cash.
This was a really involved set of questions, and I have probably not answered them very well. If you need more clarification please get back to me – and if you do one question at a time it might be easier!
Hope this helps
h
Love your teachings I’ve been trading options for a while and think this the best strategy I’ve seen. Are you familiar with XSP? The SPX index minis? Although it is lower volume than spy it offers more favorable tax treatment at 60 LT and 40 ST if trade short-term. Thoughts on using this rather than SPY if you are using a brokerage ?
Hi Dan,
I’m not the author of the book, but I thought I’d share a few personal thoughts in case they’re helpful.
XSP is priced similarly to SPY, but its liquidity is noticeably lower. For example, I just checked the call options with a 500 strike expiring on 12/17/2027. On the Robinhood app, XSP shows a bid/ask spread of 180/195, whereas SPY’s spread is 185/188.
That wider spread can make a big difference—if you buy at 195 and later need to sell at 180, that’s a $15 loss even if the market hasn’t moved. In contrast, SPY’s tighter $3 spread offers more flexibility. Liquidity really matters—if there aren’t active buyers and sellers, entering or exiting a position can be costly.
As for taxes, I’m mindful of the long-term vs. short-term capital gains rules, so I try to use options with 2–3 year expirations. That gives me a chance to hold them over a year and potentially qualify for the long-term rate.
I also found this article helpful when I was researching how to choose the right call option (underlying, expiration, strike, etc.): https://backalpha.com/blog/how-to-choose-the-right-call-option
Just wanted to share in case any of this is useful!
Best,
Tyler
thank you Tyler!
Yes, I’ve been a bit slack about answering questions – holidays, you know!
h
Hey Tyler very helpful but, are you not rolling the options then?
Hi Dan,
I only roll my options as the expiration date approaches, and I sell when my exit signal occurs—these actions are independent. It’s possible I might hold a position for more than a year, but if I buy call options with short-term expirations (such as six months or one year), I can’t hold them longer than their expiration.
Hi again Tyler – see answer below.
h
Hi Dan – I a, around the same m afraid that I can’t help you. I’ve checked the options chain and it is around the same price and spreads as SPY, so I guess it would be similar to trade (apart from the differences because it is not an ETF).
RE the tax treatment – you would have to consult someone who knows about tax – it is certainly not me! I pay tax in Australia not in the U.S. under the treaty so am really quite unaware of the tax implications.
Sorry can’t be more help!
h