

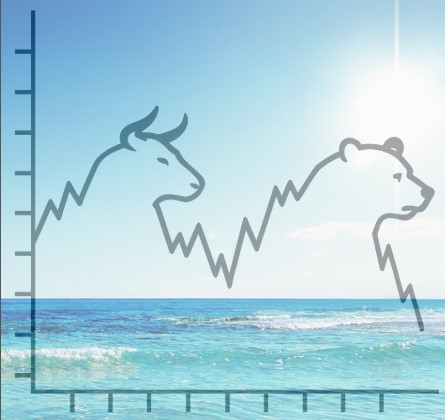
Trendlines.
The trendline is one of the simplest, and most used, tools in technical analysis – but it is certainly not an objective measure. Two traders can look at the same chart and draw entirely different lines, and both can be technically correct. It is very much a subjective indicator.
Podcast
Prefer to listen?
Objectivity
Objective indicators are calculated using a formula, and anyone using the same parameters will come up with the same value.
For example, SMAs, MACD, RSI – there is a host of objective indicators, and this makes them easy to program into back testing, for example. There’s no room for subjectivity or ambiguity. But trendlines, because they are drawn by a human, are not objective. People can’t ‘see’ them differently. Like the dancer below – which way is she going? Who is right?
Subjective Indicators
Subjective tools mean that they depend on the judgement or discretion of the traders, not a fixed mathematical formula. Trend lines belong in this category, and that is why they are impossible to use in any backtesting. That doesn’t mean that they are useless; far from it.
Predictive Tool
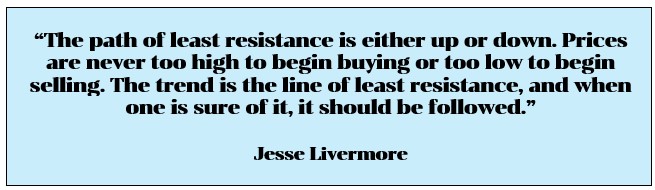
Trend lines can also be used as a predictive tool. Jesse Livermore, the original Wolf of Wall St, called them ‘lines of least resistance’. He meant that prices move most easily along the path where there is the least opposition. If a stock is going up then it is likely to keep going up until, of course, something happens to change the traders’ point of view about the stock.
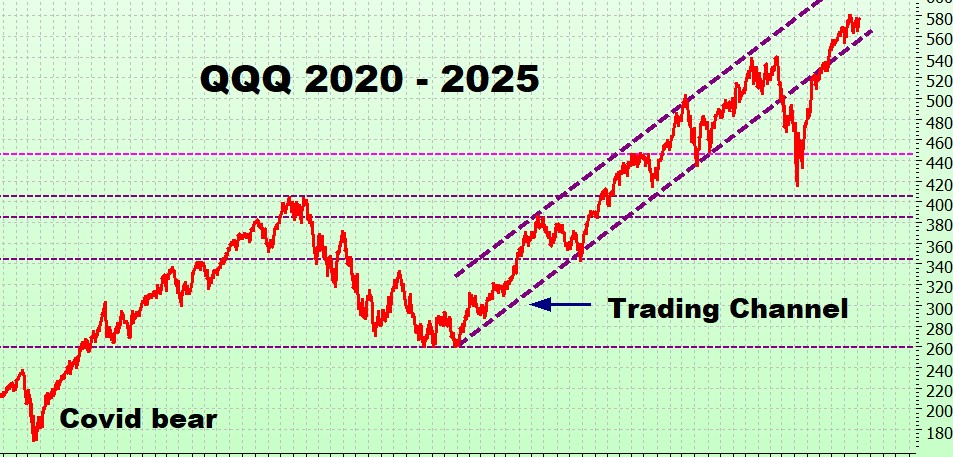
SPY & QQQ Trends

In the blog charts, I have been drawing in the trend lines as I see them – but remember that 2 different traders can look at the same chart and draw them differently.
Trend lines and support / resistance lines are much more clear than most chart patterns. Most traders would draw them at the same place.
Other chart patterns are very much in the eye of the beholder; the head-and-shoulders pattern being a classic example.
How to Draw Trend Lines
There are general rules about how you draw trend lines.
- Two points start a line, three points confirm it.
- Use the most obvious swing highs/lows (swing highs / lows are points where the price clearly reversed).
- Trendlines can be drawn using either candlestick bodies or wicks, but must be consistent.
- If price pierces the line but quickly returns, it may be noise; a close beyond the line is often used to confirm a break.
- Steeper lines are less reliable (more prone to breaking).
- Extend the line into the future — trendlines are predictive, not just descriptive.
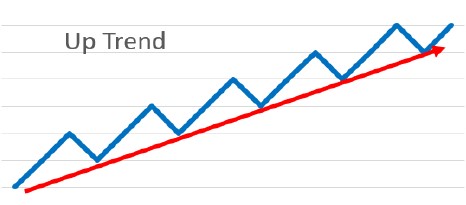
Uptrend Lines
- Drawn under price, connecting at least two rising swing lows. (a short-term trough in price — the point where a decline ends and an upswing begins.)
- The second low must be higher than the first (establishes the uptrend).
- A third touch strengthens the validity of the line.
- Line should not cut through price bars/candles — only touch the wicks/bodies at swing points
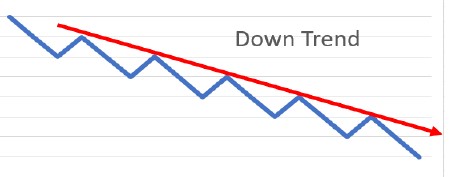
Downtrend Lines
- Drawn above price, connecting at least two falling swing highs.
- The second high must be lower than the first.
- Third touch adds confirmation.
- The line should not slice through candles, just touch the pivots.
Sounds pretty straightforward, doesn’t it? But that is leaving out:
Confirmation Bias
Many people think that this is the biggest mistake made by both professional and individual investors.
Traders tend to look for confirming evidence rather than evaluating all available information.
It is a natural human tendency; we all do it and not just in trading.
If we think the market is bullish (going up) we look for evidence to support that and dismiss evidence that would prove us wrong.
This is done at a subconscious level, we are not always aware that it is happening.
It is always good to ask yourself ‘What if I am wrong?’ and make sure that you can live with the consequences.

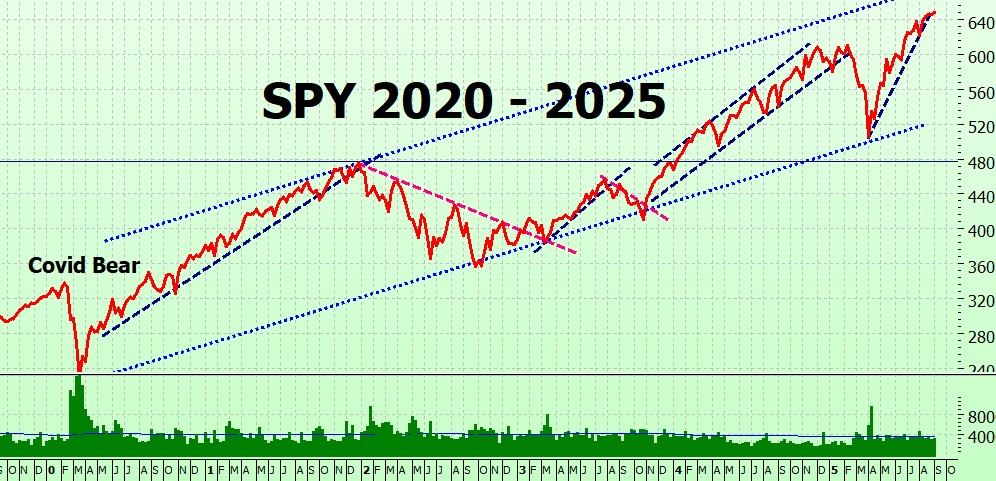
Example: SPY 2025
Here’s the Almost Bear market from earlier this year. When was the downtrend broken? In March (the pink line) or in April (the blue line)? Both are drawn according to the rules.
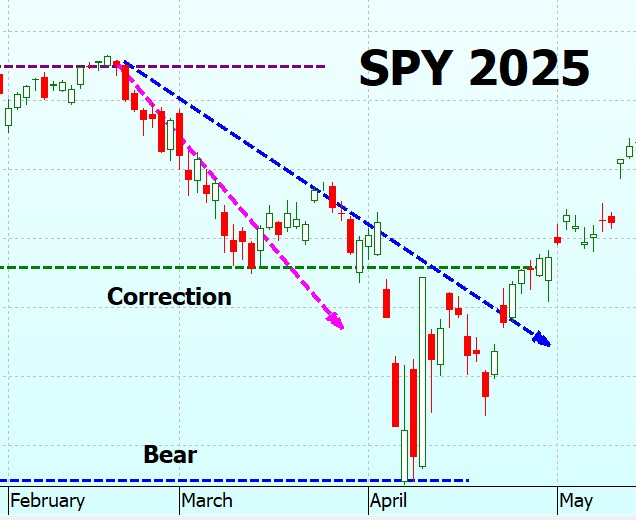
What about the uptrend? Did it finish in May? (blue) or July? (magenta) or September? (turquoise).
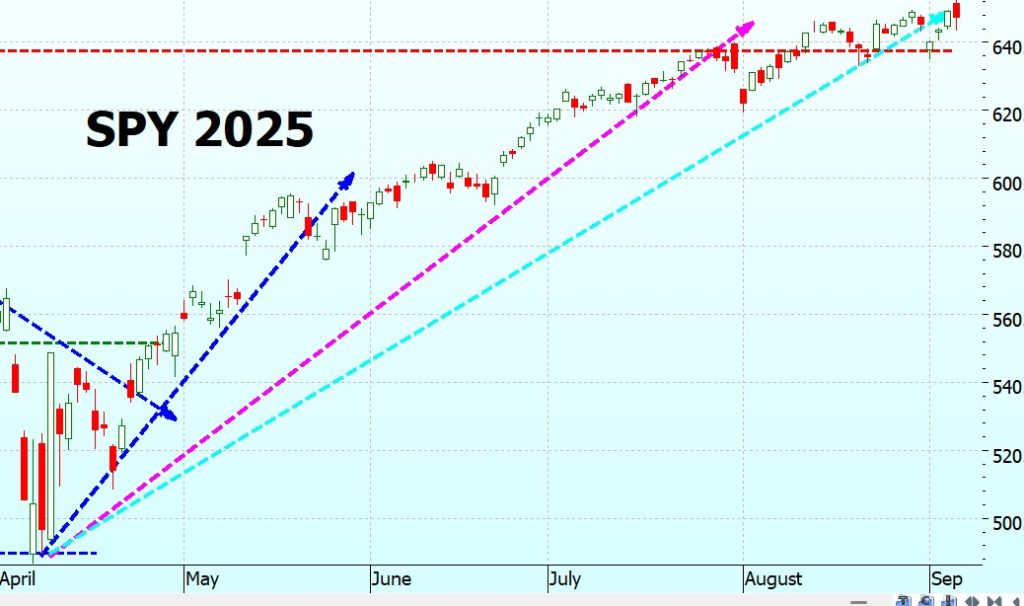
They are all drawn according to the rules. Which is correct?
Expert Analysis?
I’m not writing this to make myself look bad; it is to point out that even when following the rules people can ‘see’ things in charts in different ways, and that we should always take that into account.
And remember, even experts get it wrong sometimes.

To the market . .
And interesting week. On Friday, everyone (well, me anyway!) was cheering for the market to close on new highs, and although they were reached intra-day they didn’t make it to the close. Let’s check the charts.
SPY Charts
SPY made a new high at the close Thursday – then the bulls roared up on Friday morning, only to be slapped down by the bears. First the bulls made a new intra-day high, only to have the bears drive it down to below Thursday’s trading range. But then the bulls weren’t having any of that and drove it back up, to finish in the top half of Thursday’s candle, and on high volume.
My observation over many years has been that the market often changes direction around 30 minutes after open. I see it again and again. Look at the minute chart of trading on Friday:
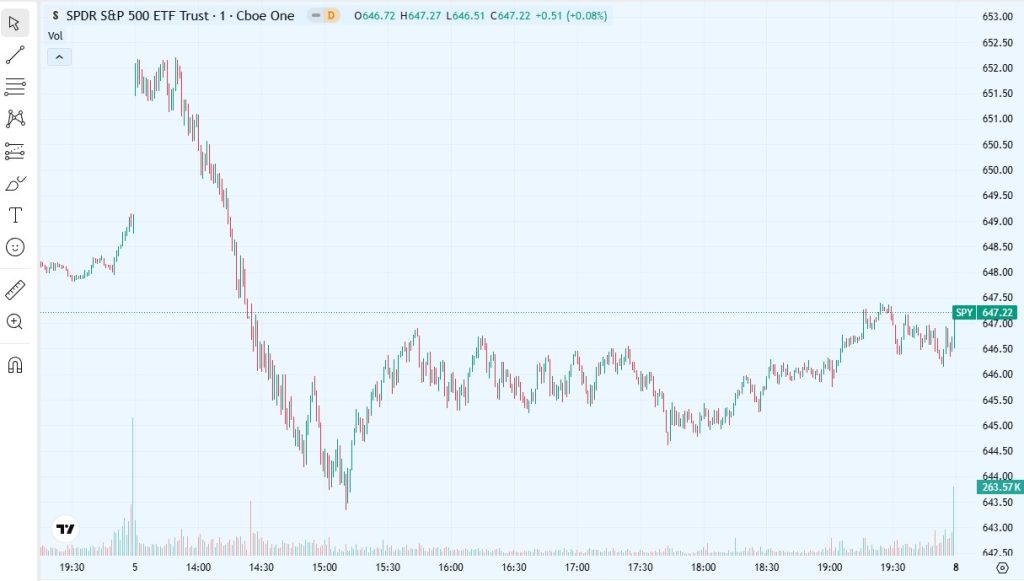
I am not absolutely sure why this happens but there is a saying
Amateurs open the market, professionals close it
That means that early-day trading at the open is often dominated by retail / inexperienced traders who are reacting to overnight news and are trading with the fear / greed emotions. On the other hand, near the close institutional money managers and professionals step in and place their orders so the close is often considered more “reliable” for reading market sentiment.
If you look at the chart above (or if it is too hard to read check it out here: Stockcharts. you can see that the highest volume is in the first hour and the last hour – the amateurs and professionals? Although from what we know about money manager performance should we really consider it more ‘reliable’?
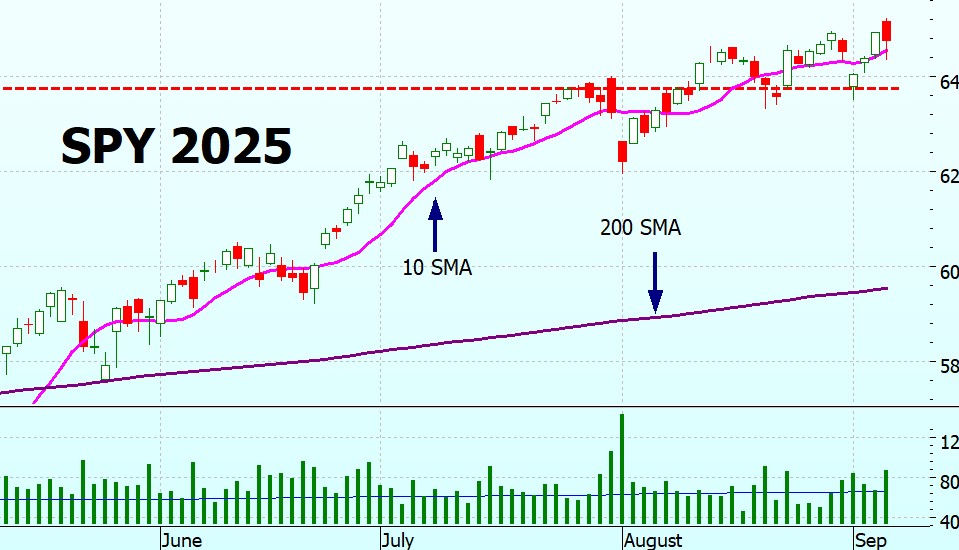
On the long term chart we see that it is still in the long-term trading range it established after the covid bear.
SPYG Charts
Darvas box, anyone? SPYG didn’t quite make a new high this week, but it is trading at the top of the consolidation patter it has been in since July. Boring. You can see that intraday it made a new high, but closed practically on the same level as the previous high. So, looking good.
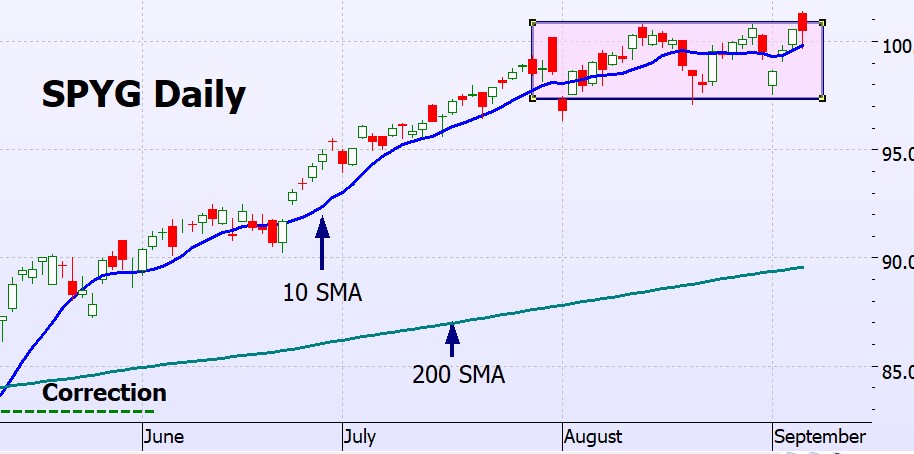
The long term chart it is still bumping against the lower bound of the trading range. If it breaks out of the Darvas box it will be in it again – fingers crossed.

QQQ Charts
On Friday, QQQ followed a very similar intra-day pattern to SPY, so those comments are valid here also. It is probably a bit too soon to draw a Darvas box, but I am sure that it hasn’t escaped your notice that QQQ has been in a consolidation patter for over a month now. It has definitely established the 560 level as support.
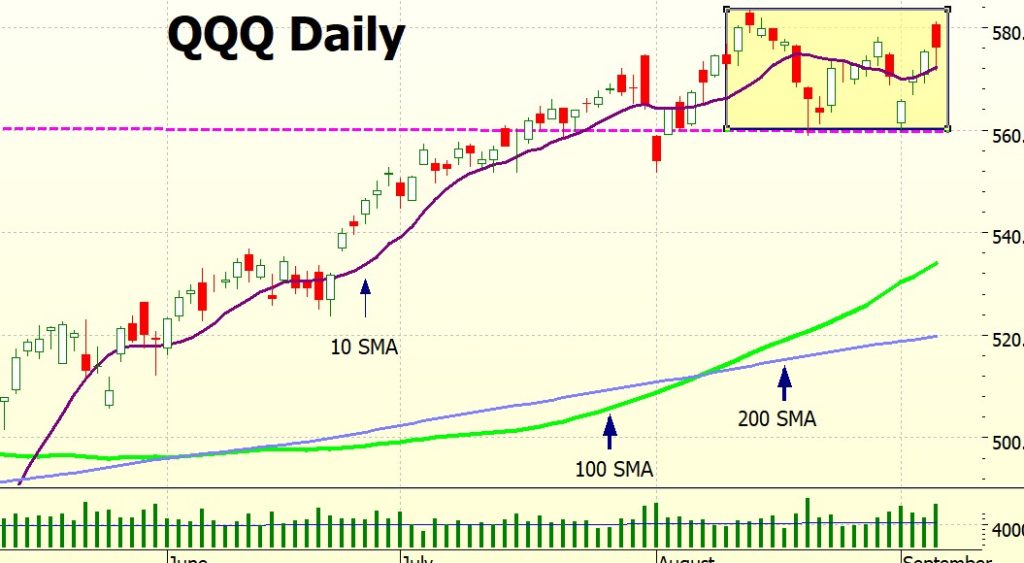
You may notice that there is a new SMA on this chart. I am backtesting on QQQ, and using various parameters – the 100 day is looking significant. When I bring out the next book all will be clear.
No surprises on the long term chart – it is still bouncing along the bottom of its trading range – interestingly, not established after the Covid bear like SPY, but after the Biden bear.
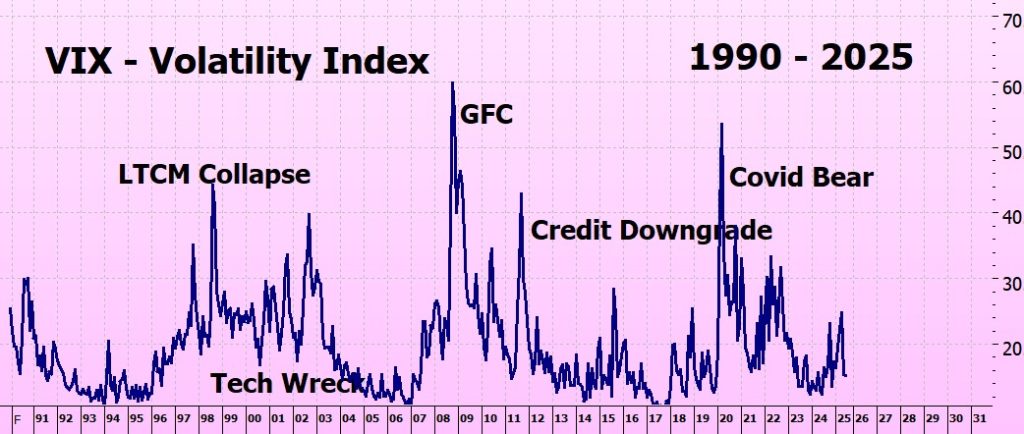
VIX Chart (Volatility)
The VIX is still in low-volatility territory.
ITMeter

The week ahead . .
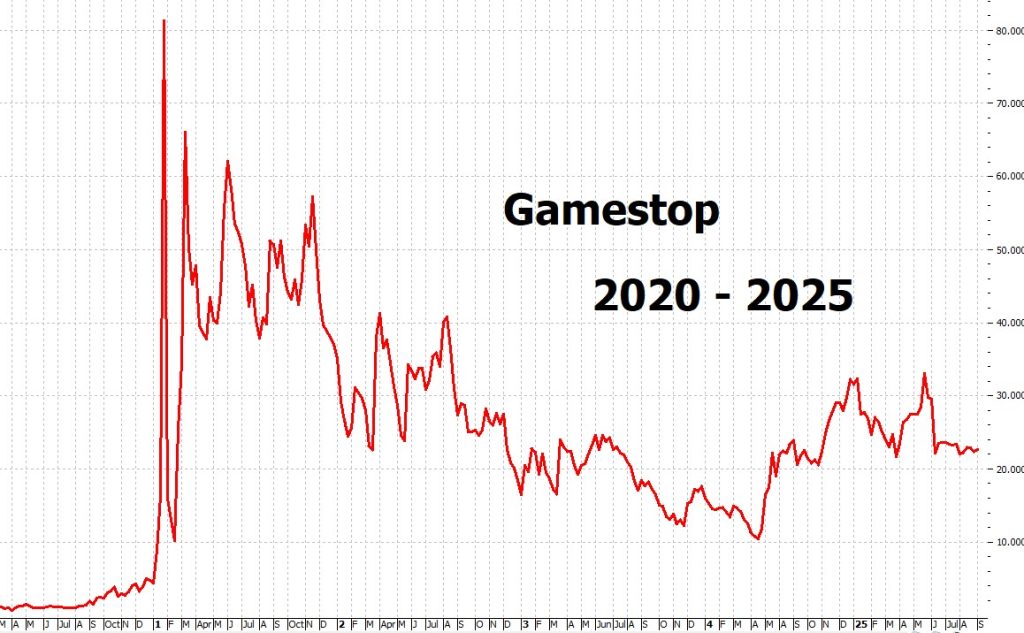
Consumer credit out Monday, PPI (Producer Price Index) on Wednesday, CPI on Thursday – all of which may move the markets. A few tech earnings: Oracle & GameStop (Tue) and Adobe (Thu). I thought it might be interesting to look at the GameStop chart – remember when it was a meme stock? See if you can find it on the chart <joke>.
Lastly, Apple’s September Event is on Tuesday 9th & is expected to launch the iPhone 17 which may give tech stocks a boost.
Podcast
I am doing a podcast with Louise Bedford of The Trading Game. It is being recorded tomorrow, and will be going live on the 17th September so I will send out a special email with the details.
Website – New Server
I have moved the website onto a new dedicated server which should be faster. You may have seen that the website was unavailable for a while over the weekend but all OK now. I hope. If you can’t see this, can you let me know? <smiley>
I’ve been having difficulty putting this blog up – it is refusing to upload images and going into conniptions – so apologies for lateness!). And one last optical illusion – market-related!

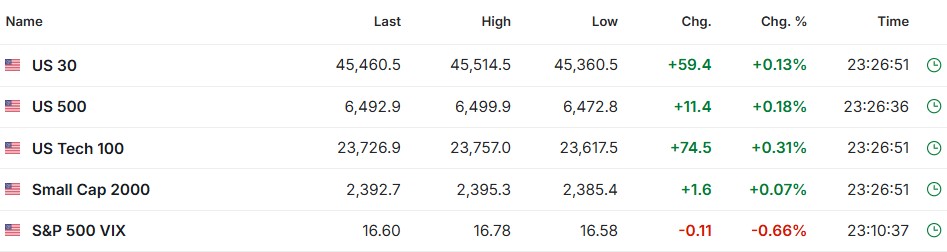
Oops - forgot - Futures
Up a bit, but 12 hours to market open.
Fingers crossed for a good week!
Heather
Trade the tide, not the waves


11 Responses
Dear Heather,
Congrats on your first podcast. I look forward to hearing it. As always, thank you for your wonderful weekly blogs.
Sincerely,
George Henry
Thank you George – I haven’t heard it myself yet, not sure that I want to listen to myself!
h
Hi Heather! That was another great blog post that I appreciate. I have a question:
If the market for whatever reason quickly got really bad with a 40-50% drop before a sell signal is hit, with double leverage, your money is gone if it does not recover before the option expires. Are you not concerned about that? I know that is unlikely. However, an extreme event or condition can cause this, regardless of circuit breakers.
Or maybe I’m not understanding, and you don’t put most of your money in 2 to 2.5x leveraged options?
Thanks for considering my comment!
This is a great question. Most traders and most investors lose money if and only if we risk too much to trade and invest. Trading and investing is a marathon of 26 years (26 miles) not a sprint. Please make sure we always have plenty of cash like Warren Buffett and Berkshire Hathaway to take advantages of any market conditions.
Ref: https://backalpha.com/strategies/crossover/spy/buy-sma10-above-sma200-percent0.3/sell-sma10-below-sma200-percent0.3/riskfree4.0/leverage2.5-timedecay2.5
Based on over 32 years of backtesting, using 2.5x leveraged call options (assuming a 2.5% annual time decay), the maximum historical drawdown was 44.95%. The strategy’s sell signal helps protect against deeper losses. For instance, according to the Transaction Timeline, the model issued a sell signal on 2000-09-28 during the tech bubble, and again on 2007-12-20 ahead of the 2008 financial crisis. Ignoring these signals would likely have resulted in catastrophic losses, potentially wiping out the account.
Hi Brian – 40-50% drops don’t usually happen overnight – but then black swans are black swans so they might.
The easiest thing woud be to buy a protective put to cover in that case. The premiums for DITM puts are very small – with SPY trading at $651 a 500 strike put for Jan 2026 would only cost $246, a 550 strike $440. March 2026 $418 and $716. So that would cover you in case of a catastrophic downturn.
Does that make sense?
h
Hi Heather, “The premiums for DITM puts are very small”, I think you meant “DOTM”, since “SPY trading at $651 a 500 strike put” is out of the money.
Yes, absolutely – you are correct, my bad!
h
Hi Heather,
That is very interesting, I never thought of that in conjunction with your system. If you don’t mind me asking, do you put the vast majority of your money in DITM calls?
And just a suggestion below:
Since you have the opportunity with your new book, you may want to consider including info on how to use puts during the investing journey of rolling calls during a bull trade to limit losses for those that want to protect against very large sudden downturns, however unlikely (and maybe even including buying protective calls if in a bear trade).
Thanks!
Love the podcast…I was waiting for the accent. I was in Chase the other day wiring funds… and the fraud department was asking questions when I told the recorded recordist “ if could predict – I would own Chase “ to the laughter of the branch… Bitcoin …
r
and then you would improve it’s customer servie? Do away with chatbots, recorded messages, etc?
I’ll join up!
h