


Open Interest & Spreads.
There’s zero open interest! Does that mean I will not be able to sell my option? It is a question I am often asked, and fortunately it is easy to answer: No. Not with SPY. Let’s have a look and see why.
What is Open Interest?
Open interest is the total number of active (’open’) options contracts (either calls or puts) for a specific strike price and expiration date.
Prefer to Listen?
In other words, options that have been created and are still outstanding – they have not been closed, exercised or expired.
Birth of an option
Where do options come from? Well, when a mummy option and a daddy option . . . OK, joking. Seriously, options are created out of thin air. Someone just decides to write one – and voila! There it is!
It didn’t exist before the trader decided to write it, now it is on the order book and becomes part of the ask side of the bid / ask spread. But it doesn’t add to the open interest until someone buys it. Then the open interest goes up by one.
Life of an option
Once the option exists, it is destined for a life of transactions. Many different buyers and sellers can pass it around many times


Does this affect the open interest?
No, it is still the same contract, so the open interest doesn’t change. Even if it is bought and sold a dozen times the OI stays exactly the same.
What does change is volume.
Every trade—every time the contract changes hands—adds to the daily volume count. So you can think of it like this:
- Volume = how many times contracts were traded today.
- Open Interest = how many contracts are still alive at end of day.

Death of an option
An option ceases to exist only when a position is closed out.
In other words, it is exercised, expires or is bought back by the original writer.
Does open interest matter?
Yes, in sparsely traded stocks. For example, BNT (Brookfield Wealth) has a current price of $68.39 and here is its options chain for November:
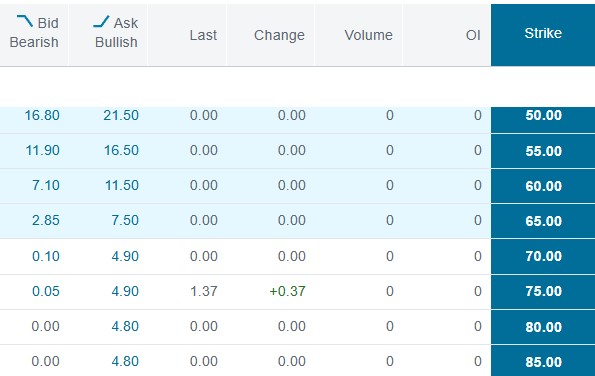
You can see how low the OI and volume is, and how large the spread between the bid and the ask, In practical terms, if you bought say the ATM 70 strike option for $490 then changed your mind and sold it again you would get $10. That’s what a wide spread can do for you! Not good.
However, with SPY there is a quite different situation.
How it affects SPY
Here is the SPY chain for ATM calls. The OI is much greater and the spread much smaller. If you bought an ATM call at the 33.68 ask, then you could immediately sell it again for $32.42 a much smaller low. But in practice you usually get filled midway between the ask and the spread so the difference in buying and selling is much smaller.
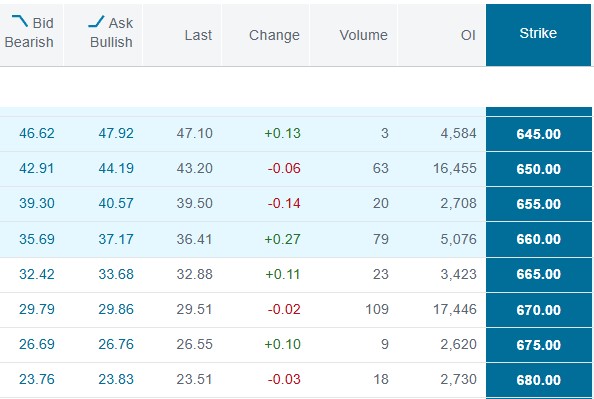
But that doesn’t answer the question: does OI affect the spread? Let’s look at the strikes 625 – 645 and the open interest.
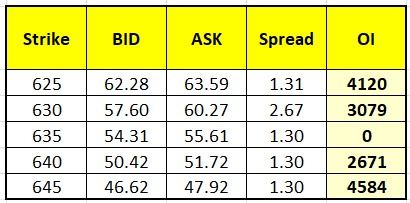
Clearly, OI doesn’t affect the spread. The strike with no OI is the same as the others – apart from the 630 strike which has a spread almost double the others. Interesting.
Sometimes you get these anomalies, this one is interesting because both the bid side and the ask side are anomalous and the market is closed. I am not sure why, so I uploaded the table to GPT for ideas and here is his take. (it is a bit long winded so I put it in a link below:
Thanks for the table. Given it’s SPY and the market is closed, a 2.67 spread at 630 while the neighboring strikes sit ~1.30 is explainable. Most likely causes (ranked by how often they do this on SPY):
- After-hours / closed-market quotes are “indicative,” not competitive.
When the floor closes, many market-makers pull tight quotes. Auto-quoters leave placeholder (wide) NBBO at some strikes. That can hit one strike (630) and not its neighbors. - Early-exercise/assignment risk around dividends.
SPY pays dividends. On days near ex-div, ITM calls around the exercise threshold get widened at the close because writers are deciding whether they’ll be assigned. One or two “riskier” strikes often show extra-wide quotes even if OI is fine. - Local model/curve hiccup at one strike.
MM auto-quoters fit an IV curve across strikes. If the fit at 630 deviates (skew/kink), they’ll pad the quote there until the open. The 635 can still look tidy even with OI=0 if its model point is clean. - Order-book imbalance / one-sided depth.
If the inside bid or ask at 630 is a small stub (very few contracts behind it) while the other side pulled, the NBBO gap jumps. OI ≈ 3,079 doesn’t guarantee tightness right now—it’s yesterday’s open positions, not tonight’s resting quotes. - Exchange fragmentation.
SPY trades across many venues. If one venue posts a far-away ask (or bid) at 630 and the other side is thin, the national best can look misshapen for that single strike.
Bottom line: at the close, a single strike showing ~2× wider than neighbors is normal noise: pulled liquidity + dividend/early-exercise risk + model padding. It doesn’t mean “something is wrong” with 630, and it often snaps back to ~the neighborhood width once live markets reopen.
Does Open Interest Matter?
To return to our original question:
There’s zero open interest! Does that mean I will be left not being able to sell my option?
With SPY there is not a problem, as you have seen. Why is there not a problem? That is explained here in another blog, here’s the link: https://heathercullen.com/market-makers/
To the markets . . .
The week started off well with new highs on Monday – then the market got cold feet and couldn’t push any higher. I expect we are in for a period of consolidation, but let’s look at the charts.
SPY Charts
SPY made a new high on Monday, then took a bit of a breather for the rest of the week. The doji on Thursday was on high volume, signaling that traders didn’t want it to go down any further, and Friday got back up over the 660 level. It would be perfectly normal behavior for it to consolidate (go sideways) for a while rather than move higher – at least until the shut down situation is resolved.
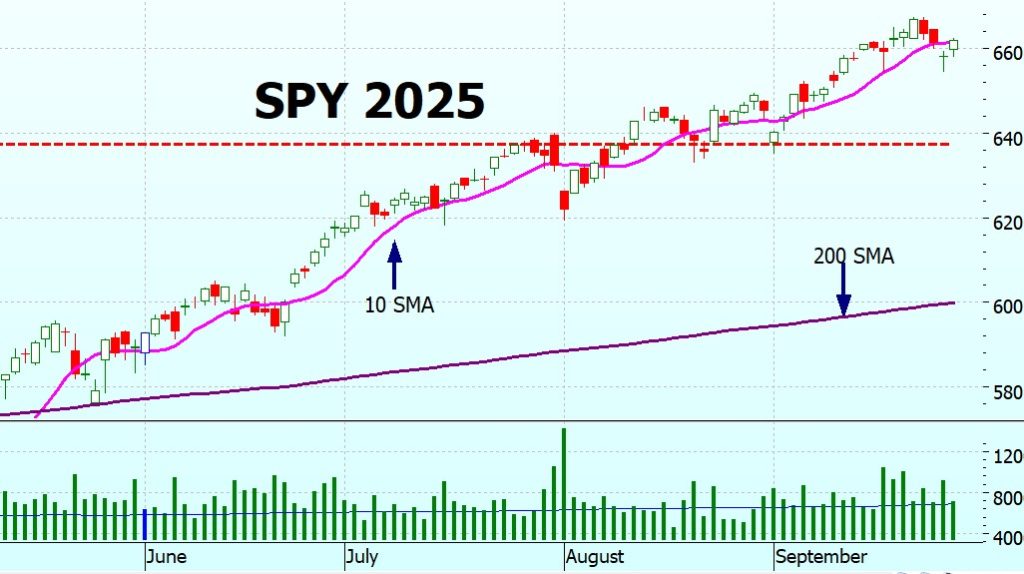
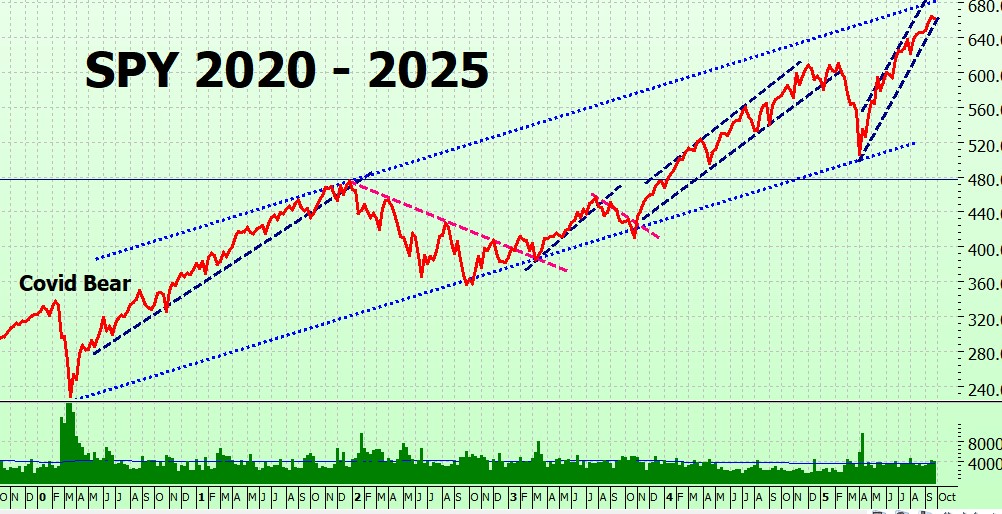
On the long term chart I have drawn in a trading channel, technically it isn’t according to the rules – but it seems as though that is what SPY is following.
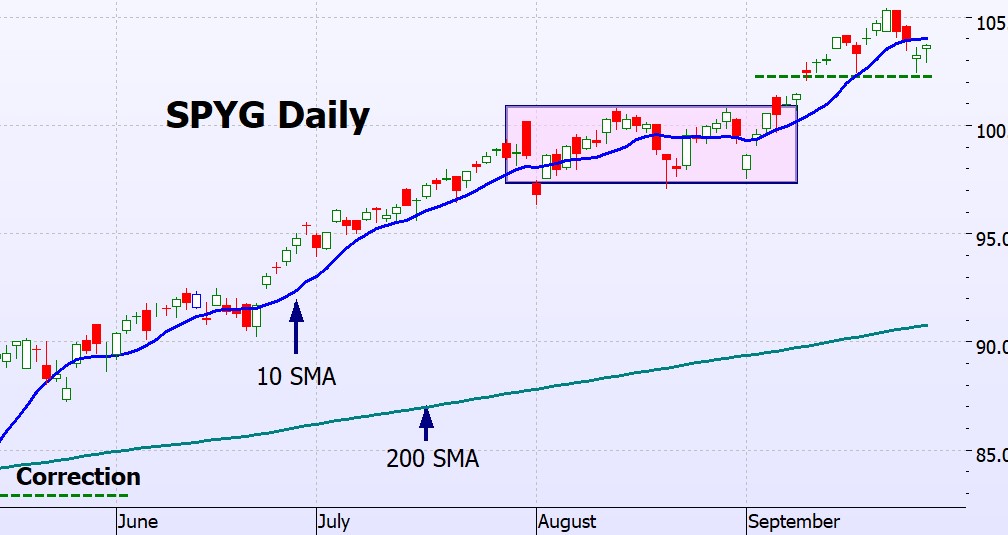
SPYG Charts
SPYG is showing the same pattern – after a new high over $105 on Monday there were a couple of down days then it recovered some ground. I have drawn in the green dashed line as a possible support line – it may or may not hold, this week will decide.
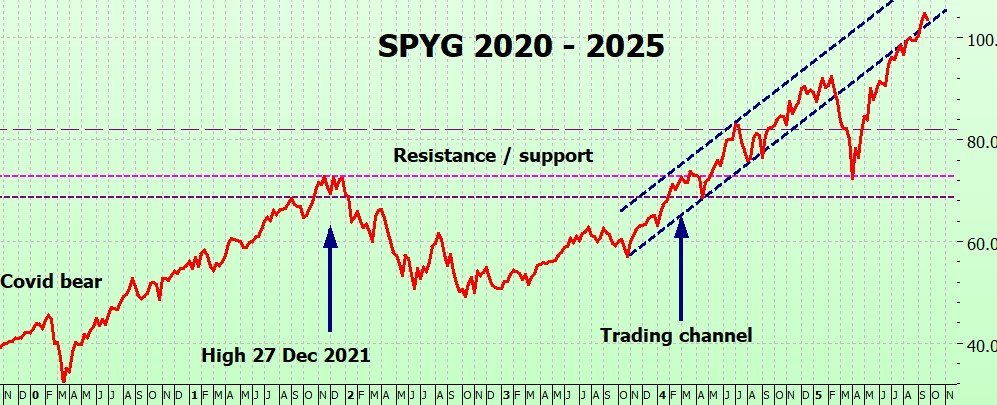
On the long term chart SPYG is still crawling up the lower bound of its trading channel. Interesting aside: those lines are parallel, but they look as though they are diverging – some sort of optical illusion.
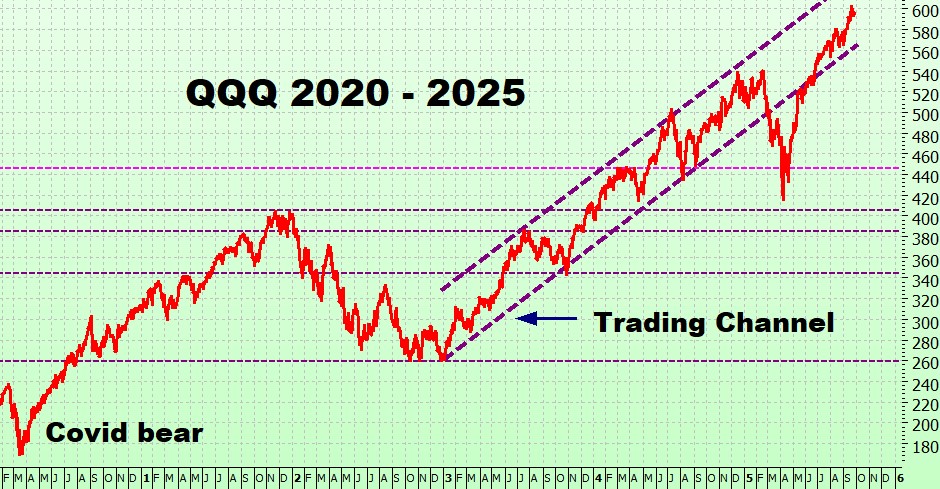
QQQ Charts
Again, same pattern. New high on Monday a couple of down days then a couple of dojis – both with a longer lower shadow. I always think that this is an encouraging sign. The bears drove the price down but the bulls weren’t having it, so they drove it back up again. Well, that’s my take on it! Volume is still above average.
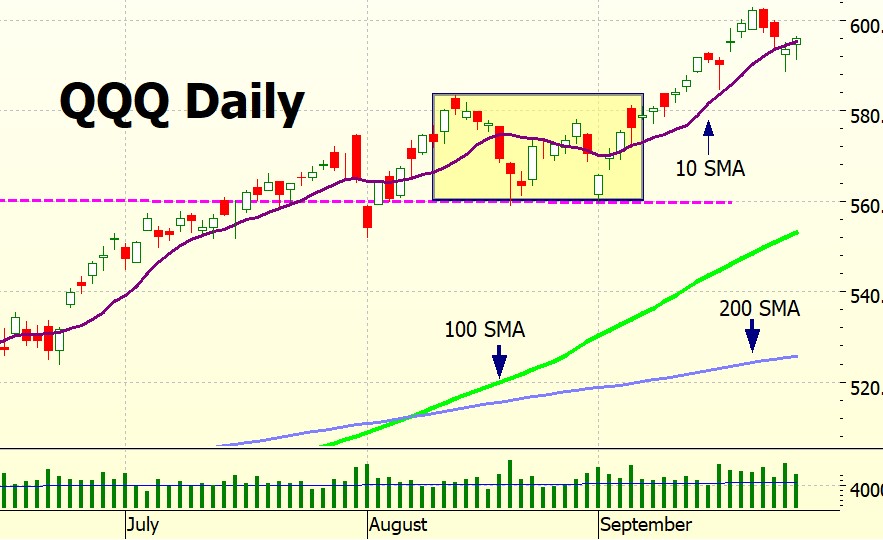
On the long term chart we can see that QQQ is now firmly back in its trading channel. As a point of interest – look how small the Covid bear was, although at the time it was huge. The bear we had earlier this year looks bigger (the Tariff Bear?), but of course that is because we are not using a logarithmic chart (thought – maybe I should do next week’s blog on log charts – any thoughts?) We see how quickly they were both over when comparing them to the Biden bear which dragged on for over a year. Gruelling.
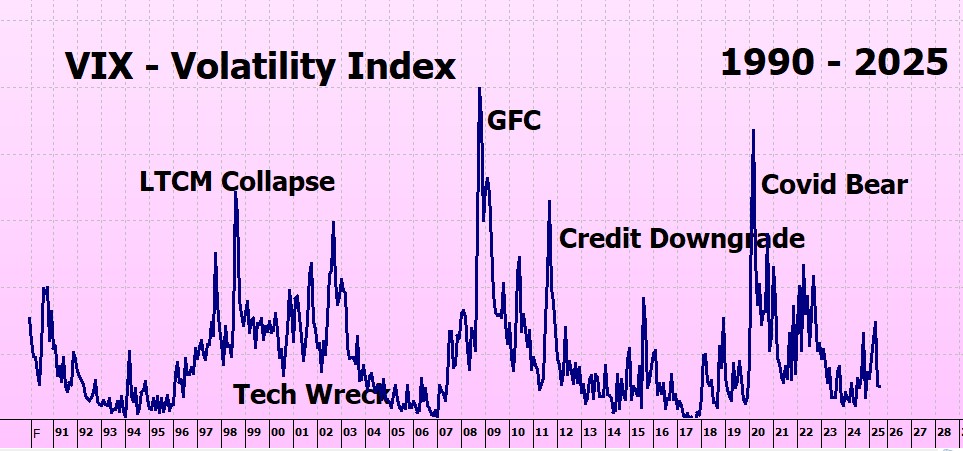
VIX (Volatility) Chart
The Vix is in low volatility territory – but looking at the really long term chart it looks as though it is getting ready for a spike (which we don’t want).
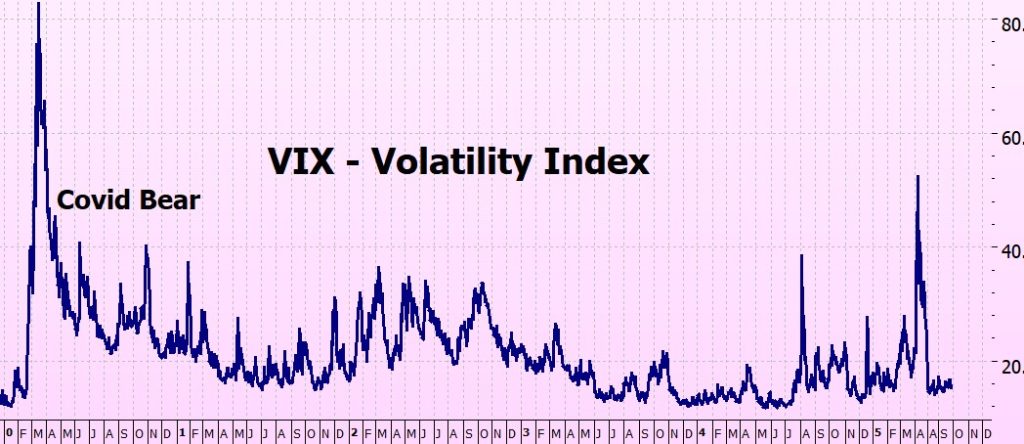
However when we look at the 5 year chart we can take comfort from the low volatility period between March 2023 – August 2024 when it barely rose above 20.
ITMeter

The week ahead . .
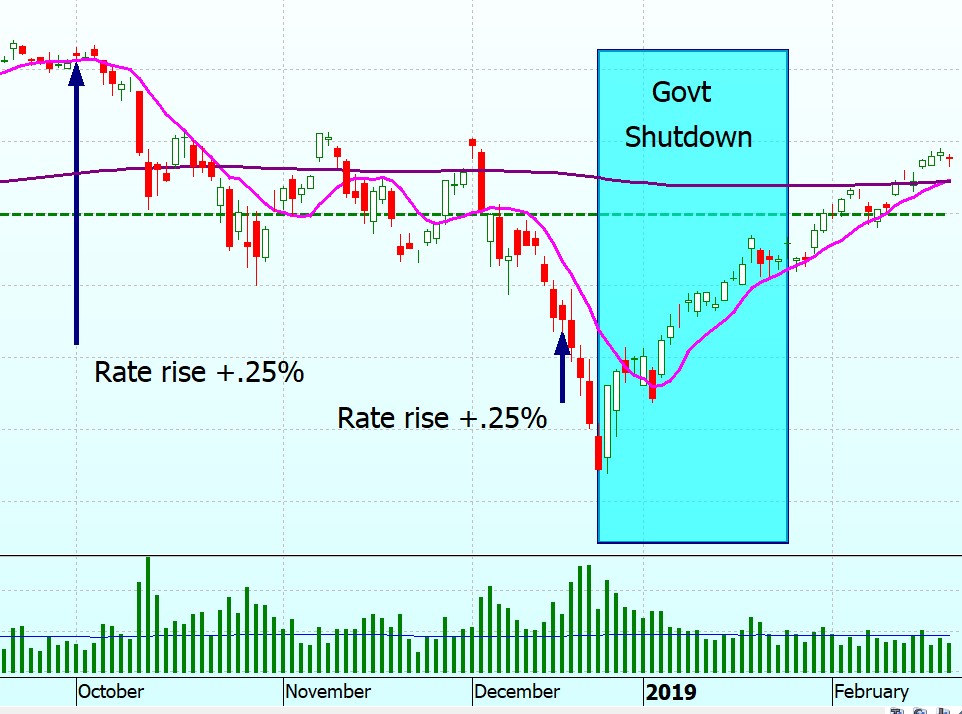
Funding for the U.S. Government is due to expire at midnight on the 30th. I am not going to get into the machinations – but to me, an outsider, it seems crazy that a country would inflict this pain on itself on a regular basis. My usual refrain: why can’t everyone just play nice? But I guess they are not going to be listening to me!
The last partial shutdown was 35 days, Dec 22, 2018 – Jan 25, 2019, and it came just after 2 interest rate rises. The chart shows what happened – the comforting thing was that the market went up during the period of the shut down, so all is not doom and gloom
The Futures
The futures don’t seem to be too worried!
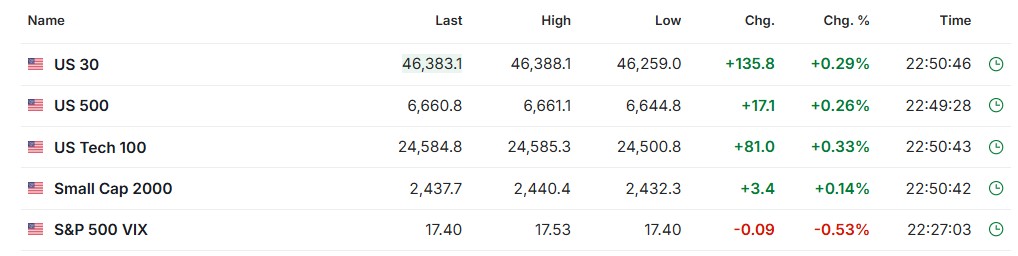
Fingers crossed for a good week!
Heather
Trade the tide, not the waves
Q & A
Related Posts
- Liquidity and Open Interest
Do Liquidity and Open Interest Matter? How can I be sure that I can sell…
- Following the Rules
Following the Rules This year has been the most frustrating year I can remember. The…
- Into a Bear Market
Into the Bear Market Finally, we got into a bear trade! After watching the market…


12 Responses
Dear Heather,
Thank you for your wonderful weekly blogs as always. For 2025, the SPY is returning almost 15% so far so I am assuming that the ITM Method will be getting 20% return so $181,000 will be $217,000.
HI George Henry – doing the backtesting now, all will be updated in the new book!
x
h
Hi Heather have only just “found” you.
I realize I could stay up all night but would prefer not to. If I place limit order I risk not being filled and would have to wait another day to try again.
Are the spreads so tight that I can risk placing market orders ?
If SPY options are traded pre market I would still be risking market moves between placing order and market opening.
I assume you have dismissed the idea of trading XJO or STW options on ASX.
Martin
Hi Martin – this came straight to my email with no return email so asnwering it here.
Quick answer – I would never put in an ‘at market’ order – put it above the ask if you want to be sure of getting filled, or just wait until market open – 22 minutes.
Well, it was when I wrote this before I realised that you had no return email.
Putting it in before market on Schwab or one of the mainstream it does no get filled until market open.You don’t have to wait up all night, just put it in at the ask or a cent above and it will get filled.
Re ASX – practically never trade it – brokerage rdideculously expensive very little choice, and it performs very badly. With the cirrent govt I can’t see that changin any time soon.
Jope this helps.
h
I’ll move this to comments and answer the rest there.
H
Heather.
I just downloaded your ITMBear book. Read straight through it with lots of notes in ch 5 & 6. Now Ill know how to act in next bear run – whenever that is.
Like the ITM, it is Beautiful !
Youve made it simple. You proved it. And you made it doable.
Like the old saying: “There’s no such thing as bad weather, if you have the right clothes”
Thank you.
David
Thank you David! I really appreciate your taking the time to write this!
x
h
Thank you so much for the comforting words on the government shut down in a few days. I’ve been extra worried about that, and this gives me some peace. Love reading your blog every week and I can’t thank you enough for guiding us and giving us your time and knowledge!!
Thank you Charity!
x
h
US government financing. . . I live here and they don’t listen to me either
Will Rogers famously quipped, “Congress is so strange. A man gets up to speak and says nothing. Nobody listens—and then everybody disagrees.”
Hey Al – too funny. That’s exactly what happens in Aus too!
h
You gave an example of spy spreads and said that the 635 spread was twice that of the rest but I think you meant the 630. Just a typo l think.
Hey James – yes, you are right.
Fixed!
Thank you
h