Well, we’re out of the market. SPY, SPYG and QQQ – all on the sidelines. Sitting twiddling our thumbs, so we have plenty of time to review our performance – and, of course, play the ‘if only we’d. . . ‘ game.
Podcast: On The Bench
(Trying out a new sound provider, Let me know what you think.)
Losses & Drawdowns
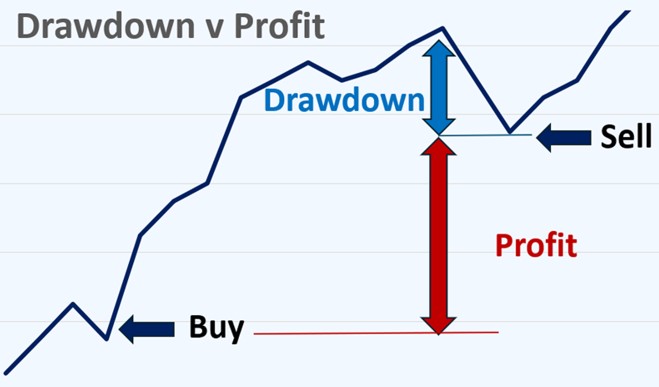
If only we’d got out at the top! The eternal refrain of the trader. Everything is so clear in hindsight . . so we beat ourselves up or look for someone to blame.Just so we are clear losses and drawdowns are different.
Drawdown usually means that you are still in the trade, but we’re not so we’ll talk about a realised drawdown.
Loss: entry – exit
Drawdown: peak – exit
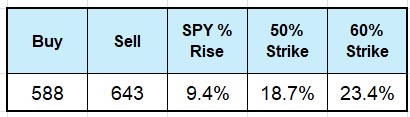
SPY Performance
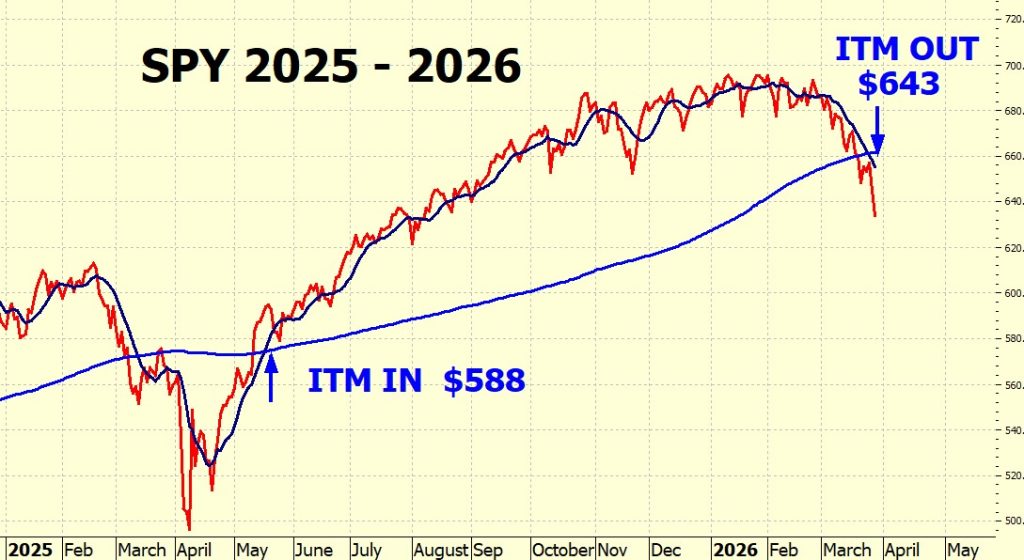
Our ITM IN was in May 2025 (after the March swoon – so similar to this year!) and our ITM OUT was last week. The figures are:
But the drawdown??
Of course, everyone – including me – will be fixated on the recent high and be count their ‘losses’ from that. We looked at recency and anchoring briefly in last week’s blog and this is how they show up: rally. ‘Why, oh, why didn’t I get out at the top????’
Hindsight is Wonderful
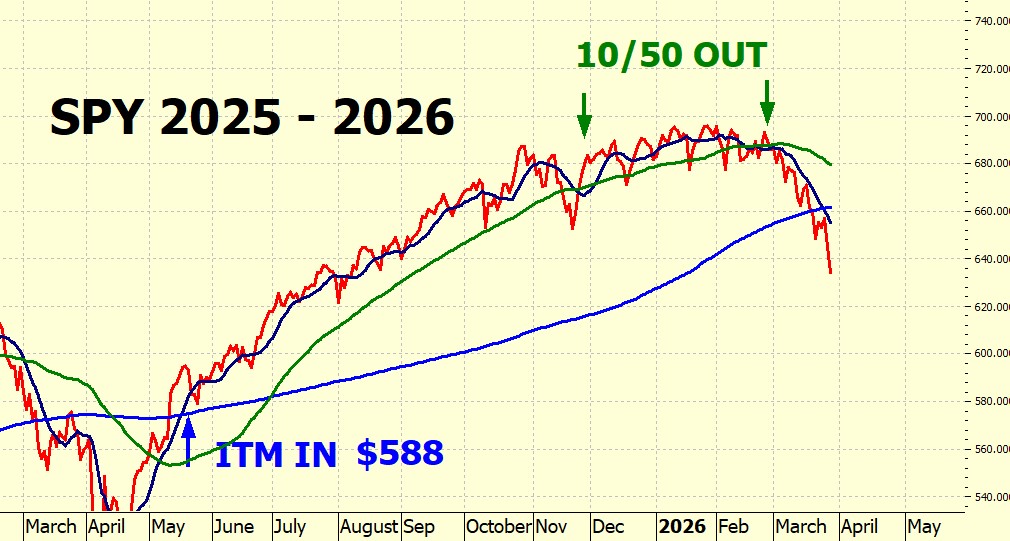
We can all be brilliant traders in hindsight. But back to reality. I will, no doubt, be fielding questions about why we waited for the 10/200 cross. Wouldn’t it be better to use a more sensitive cross to get out. Say the 10/50? That would have got us out ages ago. They are right – on this trade.
So why didn’t we? Because we don’t get to choose the perfect exit – we have to choose a rule that works every time. Instead of waiting until SPY dropped to $643 we would have been out just over $680 which would have given us a much bigger profit. So why didn’t we?
When to get back in?
That is the problem. Our IN and OUT signals must be mutually exclusive. We can’t have an IN and an OUT at the same time. If we exit on a 10/50 death cross, what gets us back in? The 10/50 golden cross? That’s testable – so we test it.
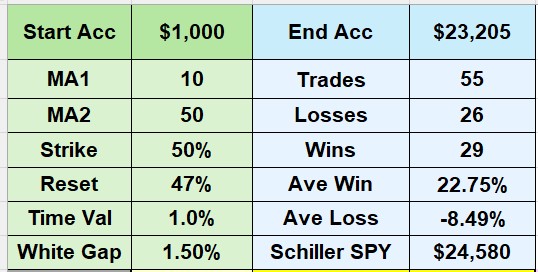
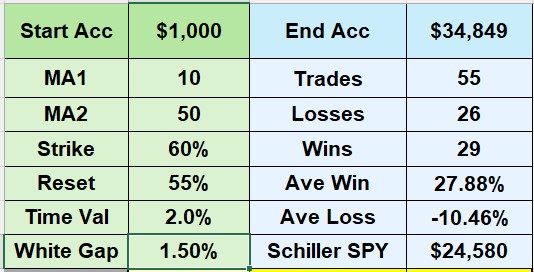
The 10 / 50 Cross
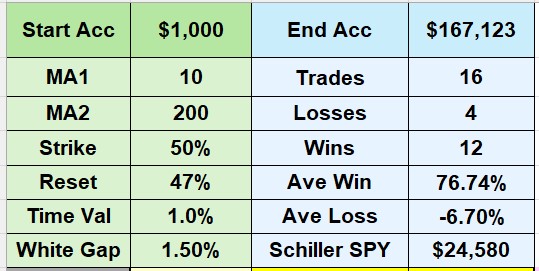
Starting in 1993 with $1,000:
At 50% strike after 32 years we have $23,205 nice – but slightly underperforming the market which made $24,580.
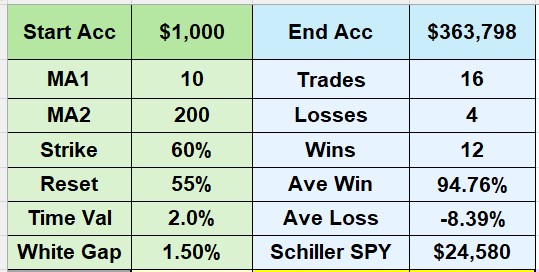
At 60% strike we beat the market by around 50%. Quite nice.
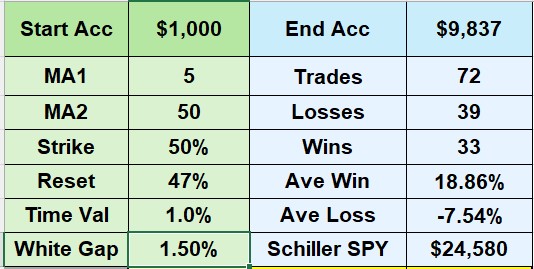
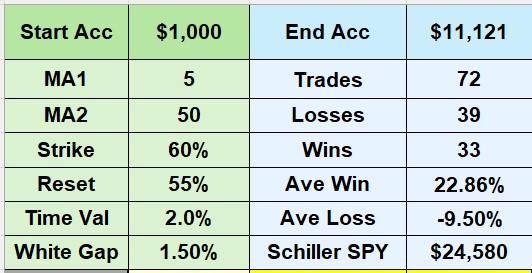
The 5 / 50 Cross
Let’s try an even more sensitive cross: the 5/50. So we run it through backtesting.
Oops. Our balance on a 50% strike is now $9,837. Not good. On the 60% strike we made $11,121, slightly better but still underperforming the market by more than 50%.
The 10 / 200 Cross
How does that stack up against the 10/200?
50% strike: $167,123
60% strike $390,430.
Well, I know which cross I would prefer!
But . . . I have a cunning plan . . .
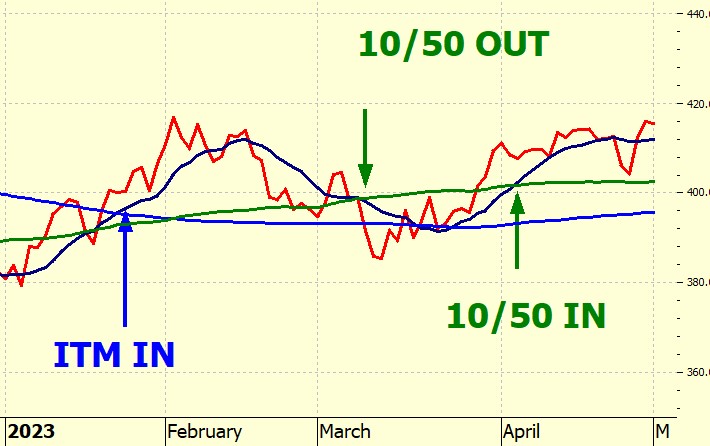
Why don’t we get IN on the 10/200 cross and get out on the 10/50 cross? Seems like the best of both worlds. It isn’t. As with many ‘commonsense’ market solutions it doesn’t stand up to reality.
Let’s look at a real life situation – the start of the bull market in 2023. The ITM IN came late January. The 10/50 OUT came early March, so we get out.
What do we do then? The ITM IN is still in force (the 10 is above the 200) so which one do we follow? The IN or the OUT?
If we do the 10/50 cross we know the result – we barely match the market. But having conflicting signals is just not something we can trade and keep our sanity.
Losses
Yes, there will be losses. ITM does not claim that every trade will be a winner. But look at the figures above, on the 50% strike:
25% of our trades were losses.
The average loss was 7%
A 7% loss is not pleasant, but no trader ever avoids losses. And I understand that for people who bought in at the top they will have a loss. Backtesting can only measure from IN signal to OUT signal.
Wins
75% of trades were wins
The average win was 77%
And that is the entire ITM edge.
New Backtesting
I am jumping the gun a bit here, and for the new backtesting to make sense you have to read the new book, but the results are here: https://heathercullen.com/backtesting/
They cover ITM Bull strategy on SPY, SPYG & QQQ, and the ITM Bear Strategy on SPY. These are the results, all will be explained in the book so please don’t ask me for details about them, let me concentrate on getting the books published!
To the markets . . .
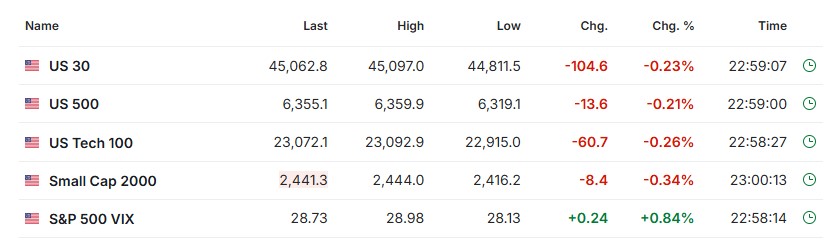
All looking dismal across the board.
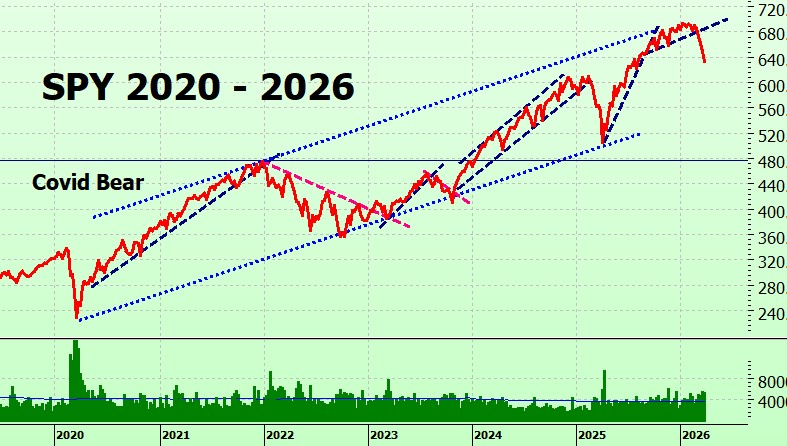
SPY Charts
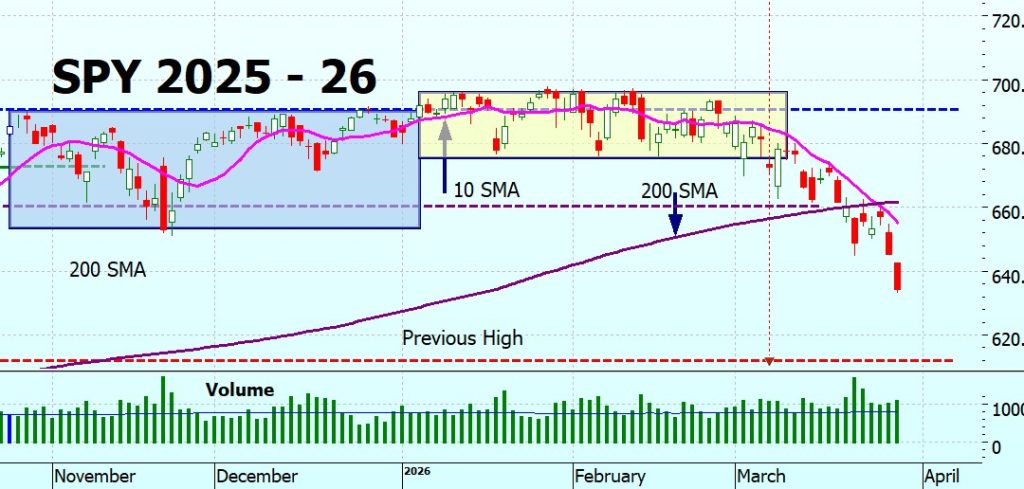
The death cross is showing up clearly. Since we dropped out of the Darvas box it has been downhill all the way. Why didn’t we trade the box? I hear you say. I’ve checked it out previously, and sometimes it works sometimes it doesn’t. It is more for us to understand what the market is doing rather than a trading decision tool.
The long term chart looks remarkably like this time last year.
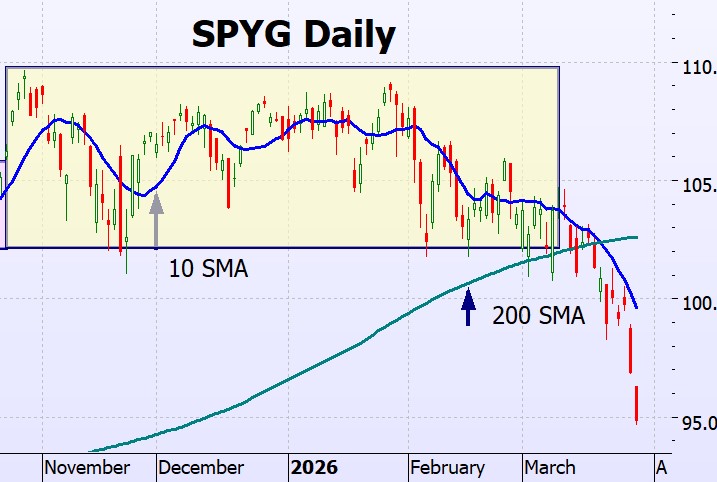
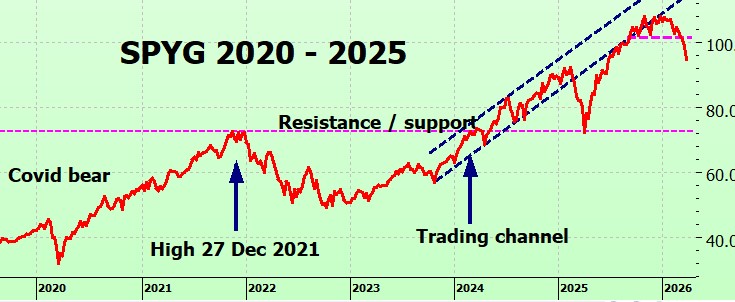
SPYG Charts
I think the term is ‘precipitous drop’! Glad we are out.
Showing also on the long term chart – very similar to this time last year.
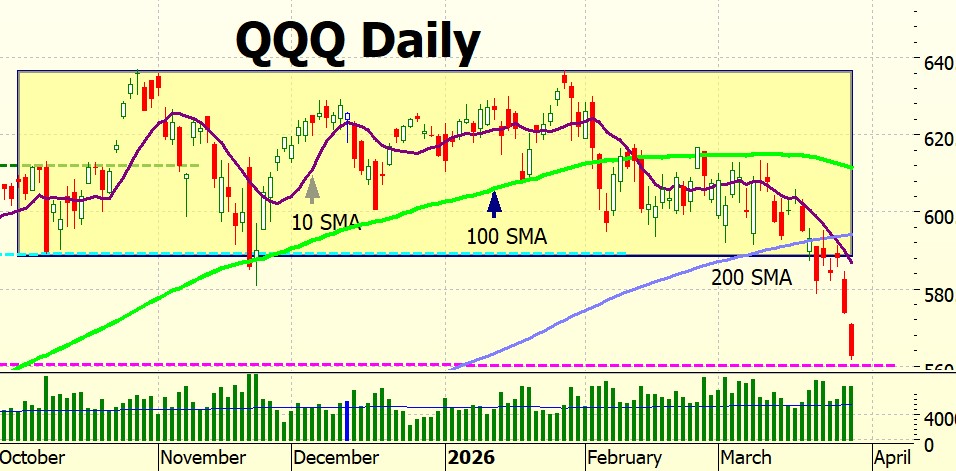
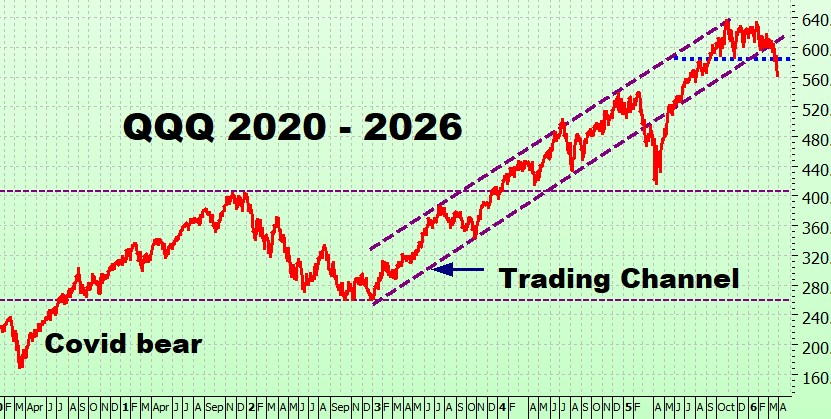
QQQ Charts
Equally as dismal. The new signal got us out at the right time. Actually, the OUT signal isn’t the 10/100 cross, but it is close enough for this situation, I’ll explain in the book. The next support level is 560, and it definitely looks as though it is heading for that. Whether it bounces or drop straight through we will know soon.
On the long term its looking like this time last year.
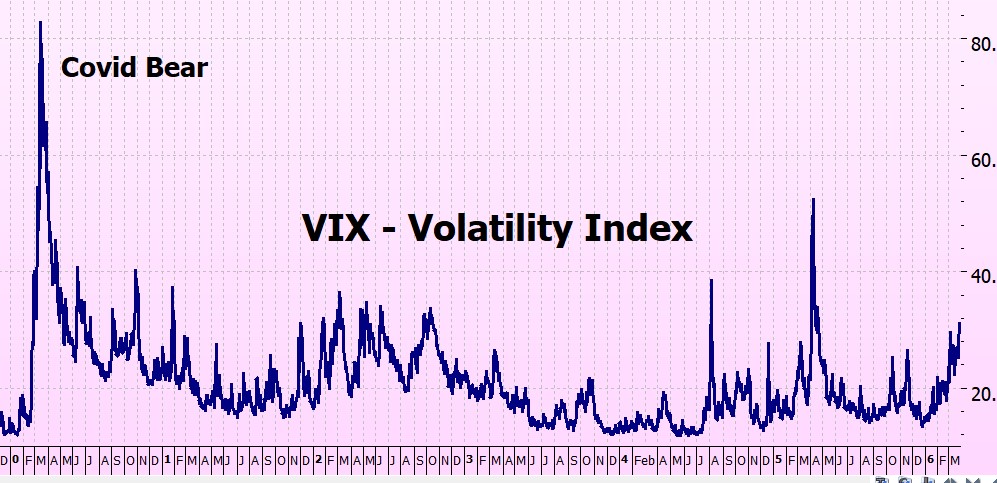
VIX Chart (Volatility)
And the VIX is heading north.
ITMeter
Well, we don’t need it right now – we are out of the market and have to wait for the dip to play out and start heading north again.
The week ahead . . .
It feels a bit pointless doing this section – the market is reacting to the war, doesn’t seem to be interested in anything else. However, here we go:
Monday – March 30 • Chicago PMI released. • Regional snapshot of manufacturing activity and business conditions.
Tuesday – March 31 • Consumer Confidence Index. • Key read on sentiment and potential spending trends.
Wednesday – April 1 • ISM Manufacturing PMI. • Broad measure of U.S. manufacturing strength and economic momentum.
Thursday – April 2 • Initial Jobless Claims and Factory Orders. • Labor market conditions and demand for manufactured goods.
Friday – April 3 • Nonfarm Payrolls (Jobs Report) and Unemployment Rate. • Most important labor market update; major driver of Fed expectations and market direction.
The futures
Looking a bit ‘meh’ – obviously can’t make up their mind, waiting for news.
Fingers crossed that this war is over soon!
Heather
Trade the tide – not the waves
Q & A
8 Responses
Insightful- I like the emphasis of following the ITM process. Thank you!
Hi Heather, I guess that the ITM Backtesting pages need some adjustments. First, if you go to the ‘Results Summary – SPY’ you see Wins 4, Losses 12. But it is just the other way round, right: Losses 4, Wins 12. Second: if you click on the ‘Bear Market’ button, you see the QQQ data, an adjustment of the link is in place.
Love your books, love your blogs, looking forward to your new book! Thanks, Bas
Ooooops!
Thank you, Bas!
I KNEW I shouldn’t have posted the links before everything had been checked independently.
I had already flagged that had to be fixed, just forgot it in all the things to do.
But thank you – and, everyone, I am sorry! My bad!
Bas is absolutely correct!
x
h
Message Hi Heather, I’ve been reading In The Money (2024 edition) and working through the strategy in detail. Thank you for the clarity and thoroughness of the book. I have a specific technical question about the 10/200 SMA signals that I haven’t been able to resolve from the book or the backtesting documentation: Do you calculate the 10-day and 200-day SMAs using the daily close price or the adjusted close price? The reason I ask: I noticed from your newsletter that the alert you sent yesterday is consistent with unadjusted close data, and the charting platforms I’ve looked at also appear to default to unadjusted close. However, for a 30-year backtest on SPY — which pays quarterly dividends — the choice between close and adjusted close can shift the exact date of some crossovers, which would affect the trade list. (With TradingView, I default to “adjusted close” and the cross has not yet enough “space”) I’d like to verify the historical entry and exit signals against your backtesting results, and knowing which price series you use is the necessary starting point. I think you retired the pdf in your blog so I cannot verify it myself. Below you can see the data for non-adjusted and adjusted closes. Thanks very much for your time. Best regards RESUMEN — 26-Mar-2026 ============================================================================================================== Close : $645.09 | Adj Close : $645.09 SMA-10 : $658.24 | SMA-10 (Adj) : $657.33 SMA-200 : $661.48 | SMA-200 (Adj) : $657.77 Dist SMA10 vs SMA200: -0.49% | Dist SMA10 vs SMA200 (Adj): -0.07%
Love your books! My coworker introduced me to your strategy and I’m working to implement it, I appreciate your note for small accounts and how to get started.
Hello Heather, anxious to get a copy of your new book. Will you let us know how to purchase. On blog or website. Really appreciate all you do and impart every week. Thank you very much. Luke
H
This isn’t a market pullback it’s a reaction to the war. Just like Covid • tariffs • etc. It’s an anomaly. And j. Powell who probably
“ Loves “ Trump is saying it’s “ inflationary “ just because He can… and talk about raising interest rates. And that would turn this into a Bear Regime. What would be the parameters to turn this into a Bear put?
R
Hi nRandy – its definitely a reaction to the war, nothing else explains it. Re bear put – it has to get to a bear market first (-20%) and we’re not there yet. Hopefully not for a long time!!
x
h