


The Start of Euphoria?
I started to feel a bit twitchy recently. Too many positive headlines! When the news is gloomy, we know we’re not in euphoria, and that’s comforting. But when optimism dominates every front page, history suggests we’re getting close to the end of the bull’s run.
Investor Survey
A new investor survey from Alpine Macro shows just how giddy the mood has become. Stock holdings have surged to one of the highest levels on record, while bonds are being dumped at a historic pace, with more than 40% of respondents underweight. Cash levels are neutral, meaning almost everyone is all-in on stocks.

Investors say they expect stronger growth ahead and think inflation is under control, but when positioning tilts this far one way, it usually signals we’re in the euphoric phase.
. Everyone’s convinced the good times will never end. But, of course, they always do. We just don’t know when.
Wall St Journal Report
The Wall Street Journal recently reported that more working-class Americans than ever are investing in the stock market.
More than half of households earning between $30,000 and $80,000 now hold taxable investment accounts – many of them opened in just the past five years.
It’s a sign of how deep the bull market’s confidence has spread: when everyone feels like an investor, history suggests the party is closer to its end than its beginning.

Market Bubble?
This WSJ headline was deeply worrying:
Why the stockmarket ‘bubble’ could last for years

It’s a comforting thought that a bubble could just keep inflating for years—but can it?
History shows us that the more inflated the bubble the harder the pop when it bursts.
The argument always goes that this rally is different.
AI, productivity gains, falling rates, and new retail money will support prices indefinitely.
Maybe so – but every bubble sounds reasonable at the top.
When investors start explaining why gravity no longer applies, it’s usually a sign they’ve stopped looking down.
It’s the classic setup. Every generation finds a reason why this time it’s different – why the old rules no longer apply and the boom will go on indefinitely. But as Sir John Templeton warned,
The four most dangerous words in investing are:
‘This time it’s different’
That’s to remind us that investors always find new justifications for old mistakes – each cycle dressing up the same euphoria in different reasoning.
Bull Market Phases
I’ve always taken heed of another Templeton quote:
Bull markets are born in pessimism, grow on skepticism, mature on optimism, and die on euphoria.
By that measure, we’re now into the final act.
Being a Jonah?
No, just being a realist. I, as much as anyone, want the bull market to go on, and it may well do so for some time yet. If we are now in euphoria we have only just arrived. Up until recently, the financial press has been full of doom and gloom – which I rather liked because it meant that we were nowhere near the final throes.
Do we take action?
No action required just yet. We’re entering euphoria — the last stage of a bull market — and it can last for months, even years, as it has before. I’m not sounding an alarm, just noting where we are in the cycle.
Is it ITM OUT?
Not yet. The market still looks set to climb for a while, but I’ll be watching for rising prices not backed by higher volumes – the tell-tale sign of fading conviction.
When that happens, I’ll wait for the ITM OUT signal before making a move.

Keeping it in perspective
Here’s a chart I made for the new ITM book. It shows how little time we actually spend in bear markets. Quite the opposite of how much time we spend worrying about them.
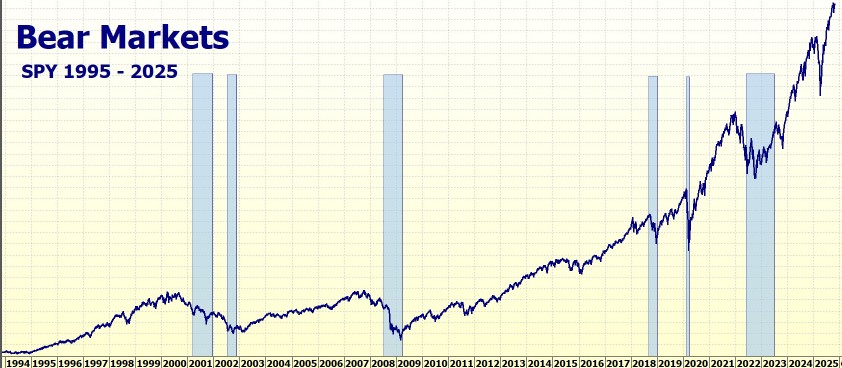
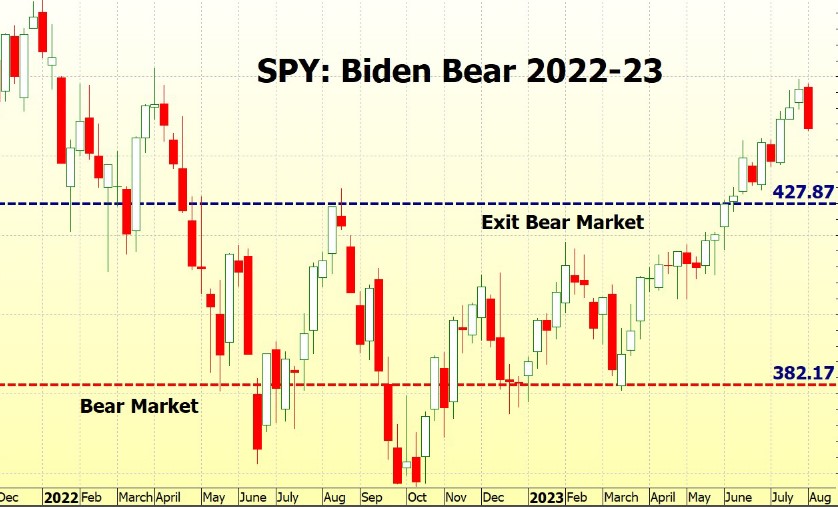
Bull markets go on for years – usually 4 – 5 years. The longest recent bull was 12 years (2009 – 2020) when it gained 400%. This bull started in June 2023 (after a 17 month bear market, longer than the average 11-12 months over the last 40 years) so based on the stats we probably have a couple of years of a bull market left. Let’s hope so!
To the markets . . .
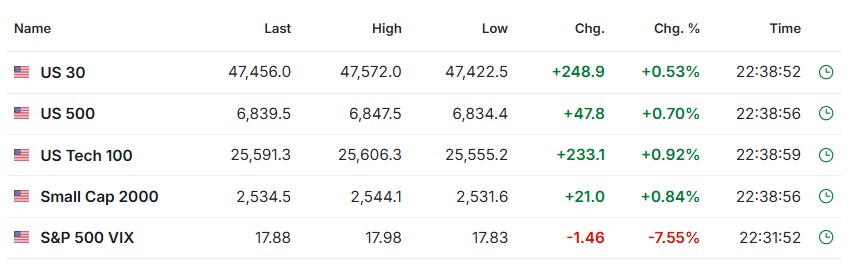
A rather nice week, with all 3 breaking to the upside and making new highs.
SPY Charts
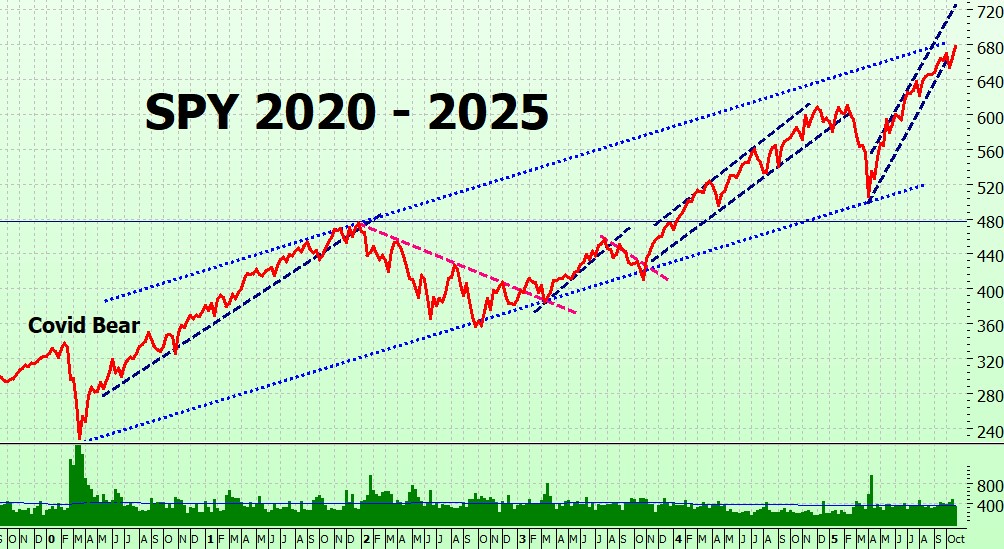
A new high on Friday! And on (slightly) above average volume, a small body candle with small shadows, suggesting that traders pretty much agreed on ‘fair value’ for the day. I wrote last week:
Momentum is coiling – the longer the compression, the sharper the release. The underlying trend is still up, so the odds favour a breakout to the upside; but if it breaks to the downside, the volume suggests the move could have teeth. Whichever blinks first, bulls or bears, it’s going to be significant.
Well, we now have our break to the upside. Let’s hope that it continues.
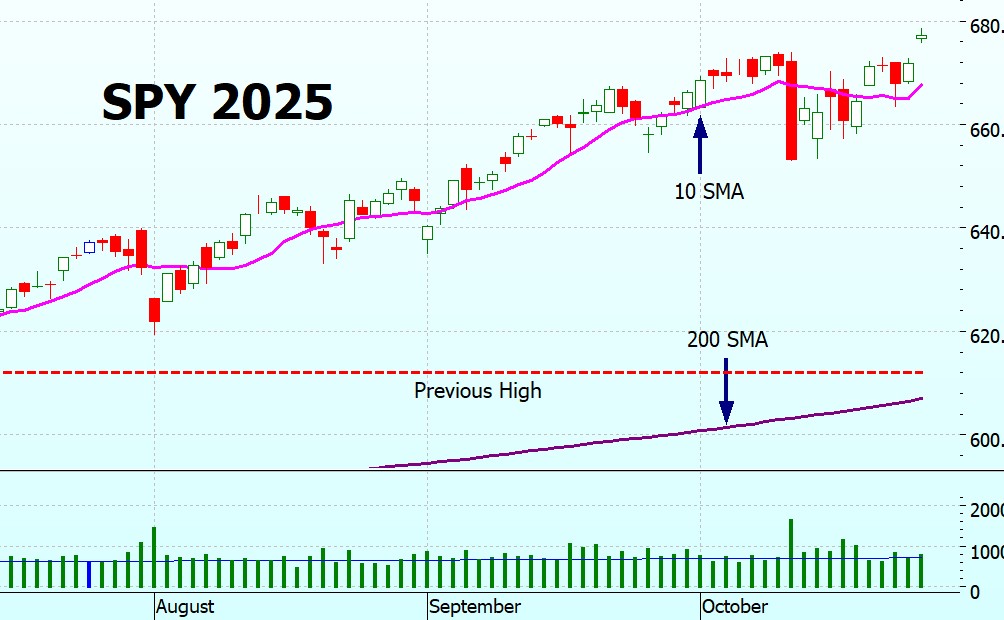
The long term chart shows SPY back in its trading range, slightly above the lower bound.
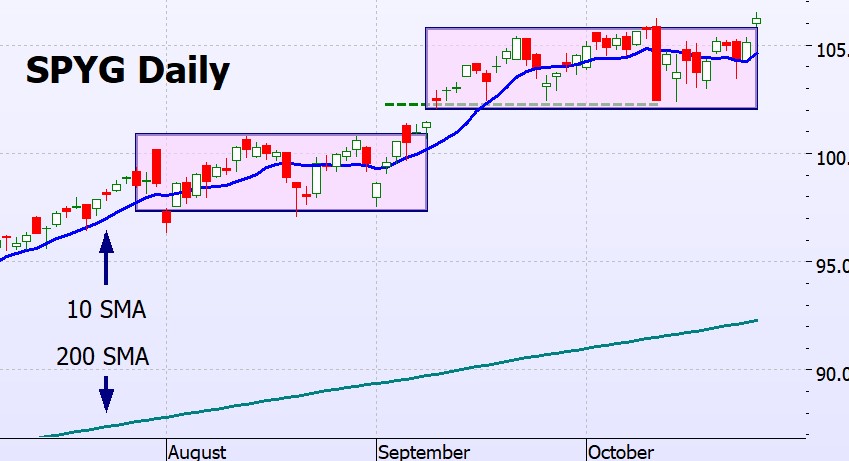
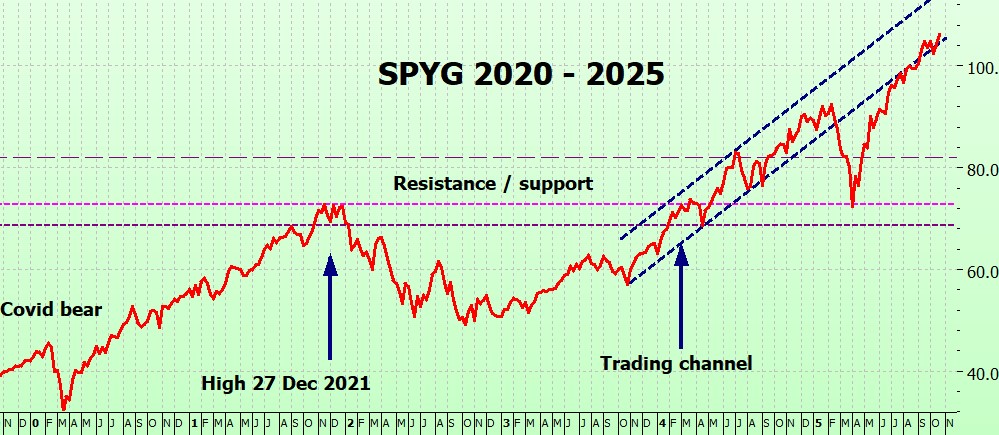
SPYG Charts
SPYG is following the same pattern as SPY. Clearly jumped out of its Darvas box, on the upside. A good sign.
On the long term chart SPYG is slightly above the lower bound of its trading channel.
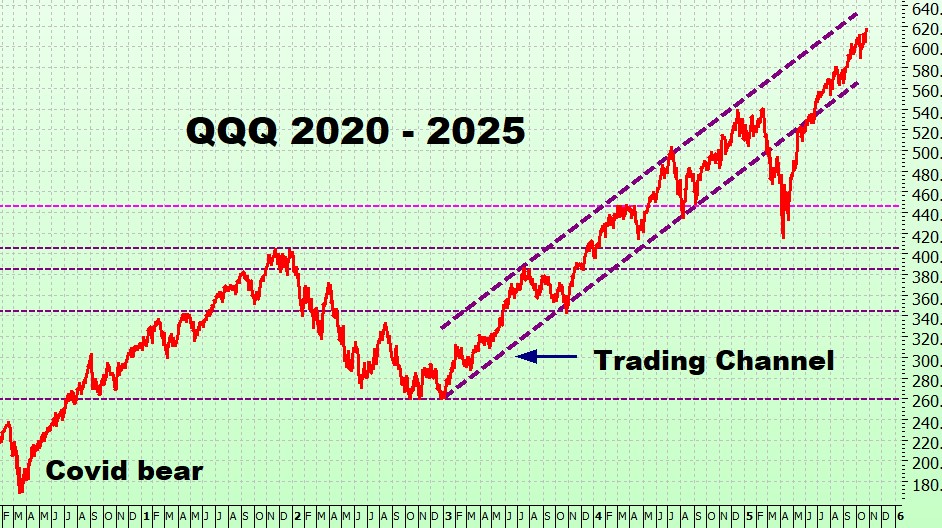
QQQ Charts
QQQ has also made new highs, breaking above 610 to the upside. Like SPY, on slightly above average volume and a small-body small-shadow candle.
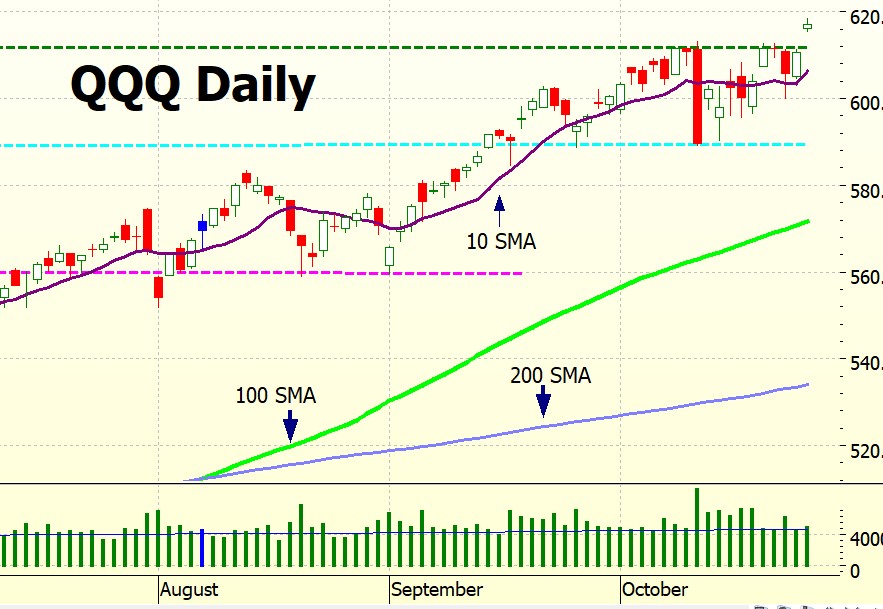
On the long term chart QQQ is neatly in the middle of its trading channel.
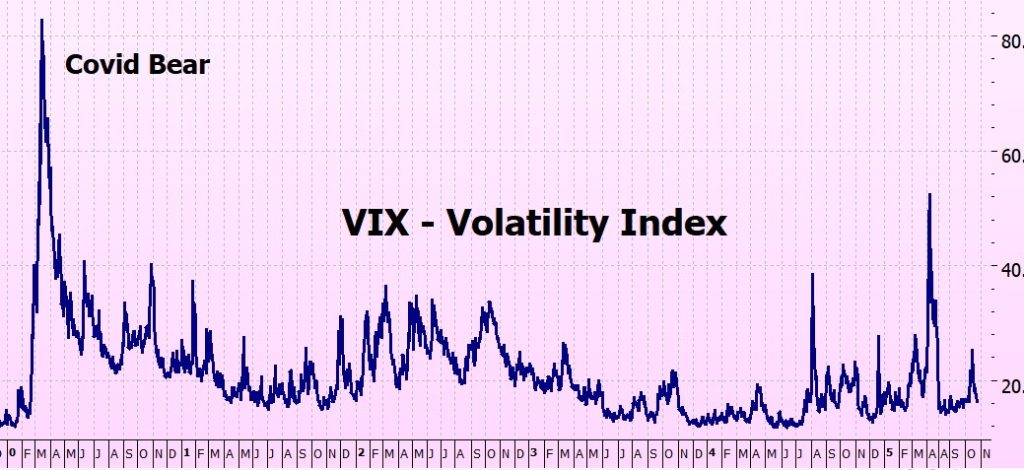
VIX Chart (Volatility)
The VIX is comfortably below 20, in low volatility territory.
ITMeter

The week ahead . .
The Fed will announce its interest rate decision on Wednesday, 2PM NY time, and everyone is expecting a cut. (The market will have a tantrum if it doesn’t!).
Some big techs are reporting this week:
- MSFT, META, GOOG/GOOGL – Wednesday after market close.
- AAPL – Thursday after market close.
Economic data – Consumer confidence on Tuesday.
The government shutdown has fallen off the front page, although at 27 days it’s now one of the longest in U.S. history. The most recent one was in 2018–19 and lasted 35 days.
I’ve been reading up on how the system works, and it turns out this is the equivalent of what we in Australia call a Supply Bill – funding the government’s operations. The last time it happened here was in 1975, and it led to the Governor-General sacking the government – a huge crisis at the time. Yet it seems to happen regularly in the U.S.! Hard to understand. But keeping off politics!
The futures
The futures are quite euphoric this morning . . .
No Blog next week: I am off gallivanting again so the next ITM Blog will be on the 10th Nov. If anything drastic does happen between now and then I will do a special blog and send out an email. But lets hope I don’t.
Fingers crossed for a good week!
Heather
Trade the tide, not the waves
Q & A
Hey, sorry everyone – was wondering why there were no comments / questions – and then realised that they weren’t working!
Oops!
Apologies – hope they will work now.
x
h
Related Posts
- Bull Runs
Bull Runs & Bear Markets. I used the term ‘bull run’ last week which may…
- Is It A Baby Bull?
The start of a new bull market? ITM Special Update We have had the signal…
- Bull Markets
How long do bull markets last? What we are really asking is : how long…


7 Responses
When the shoe shine man starts giving stock tips, it’s time to get get out of the market. I forget what great investor wrote about that experience. He said he went to his office and existed the market that day.
Of course smart traders don’t get in at the bottom or get out at the top. They make their money on the middle part of the market.
Larry
yes, a bit worried about euphoria – but yesterday punctures that a bit.
And I do recall the story of the shoe shine man – had a similar one myself just before that GFC and got out – a little early, but it saved me from some pretty horrible losses.
And no-one – except in their imagination – every gets out at the top!
x
h
I have a question about timing new $ investments. The longer we rise from the cross, the greater the risk. If you were working a salaried position, would you hold off on contributing new $ until the cross down (and back up) or continue investing until the cross down despite the added risk? The market has gapped up several days in a row now, which makes me cautious. Thank you!
Hi Michael, I understand that you want to be cautious, and the recent spike up reversed yesterday – but then again, the futures 4are up!
I can’t advise you whether to get in of not, I can only say that from my own experience every time I have waited for a ‘good time to get in’ – the market always takes off without me!
And re waiting for a deathcross so that you get a ‘fresh’ golden cross – I don’t advise that as in the past there have xometimes been years without a death cross.
I’m just downloadint data to my charts no, I will have a look and see what is going on.
OK well, we are off the highs – I would watch the 680 leve – if it holds that is a good sign – we haven’t closed the gap up yet, once that is closed we are probably going to have some more pain.
But I have just checked the futures – they have made up around 75% of yesterday’s loss, so maybe it was just a wave.
I still think that the market is going up, no real signs of exhaustion.
Hope this helps
h
Thank you for mentioning this, Richard!
Sorry if this is a duplicate. I don’t think the first message went through. I primarily trade options, usually short/long vertical spreads on high-volume stocks and ETFs over $100/share, so I appreciate your clever approach to using DITM calls to enhance SPX returns with minimal theta decay. The strategy’s minimal time maintenance, along with excellent results, is very appealing. The ITM Bear is icing on the cake; the bear market is an area where I feel less confident trading Two queries: 1. The XSP offers tax advantages, at least for US traders, but OI is thin except for monthly options, and still far less than the SPY. Bid/ask spreads are comparable, but somewhat higher. It looks workable. Do you see an issue? (I know you are not a tax expert, and I am not looking for comments on that) 2. A good part of the gains on the SPY result from a small number of stocks, e.g., AMZN, MSFT, NVDA, etc. An equally weighted index of the SPY has far smaller gains. Comments? Nevertheless, your backtesting has convinced me to buy the 3/20/26 $400 calls along with the 3/20/26 $65 SPYG calls. I will likely change the SPY calls to XSP calls for the tax advantages in the new year. Thank you! Richard
HI Richard – someone asked about XSP a couple of weeks ago – and this was my reply:
yes, you are right – I am not a tax expert! I do understand that XSP qualifies for 60/40 tx treatment – but that’s about all I know.
You see, I am based in Australia, and these have international restrictions so on Schwab I can’t even see the options chain!
They are European options, and my experience with them is that they behave quite differently to American options – price-wise I mean. But that’s just my observation, I have never really studied it.
Just check the spread (if it is more than, say, 4% I would reconsider) and dip your toe in the water gently – and do let us know how you get on!
and (2) – I think indexes are the safest (and backtested) simply because they are ‘the moopd of the market’ and any individual stock shocks are diluted. I am sure that by carefully selecting stocks you could get better results that SPY – but that is using hindsight, we can’t predict what is going to happen. But in the new book I have streamlined the backtesting so that you can recreate it yourself – and see if your idea checks out.
h