Here is a glossary of key terms and concepts discussed in Chapter 3:
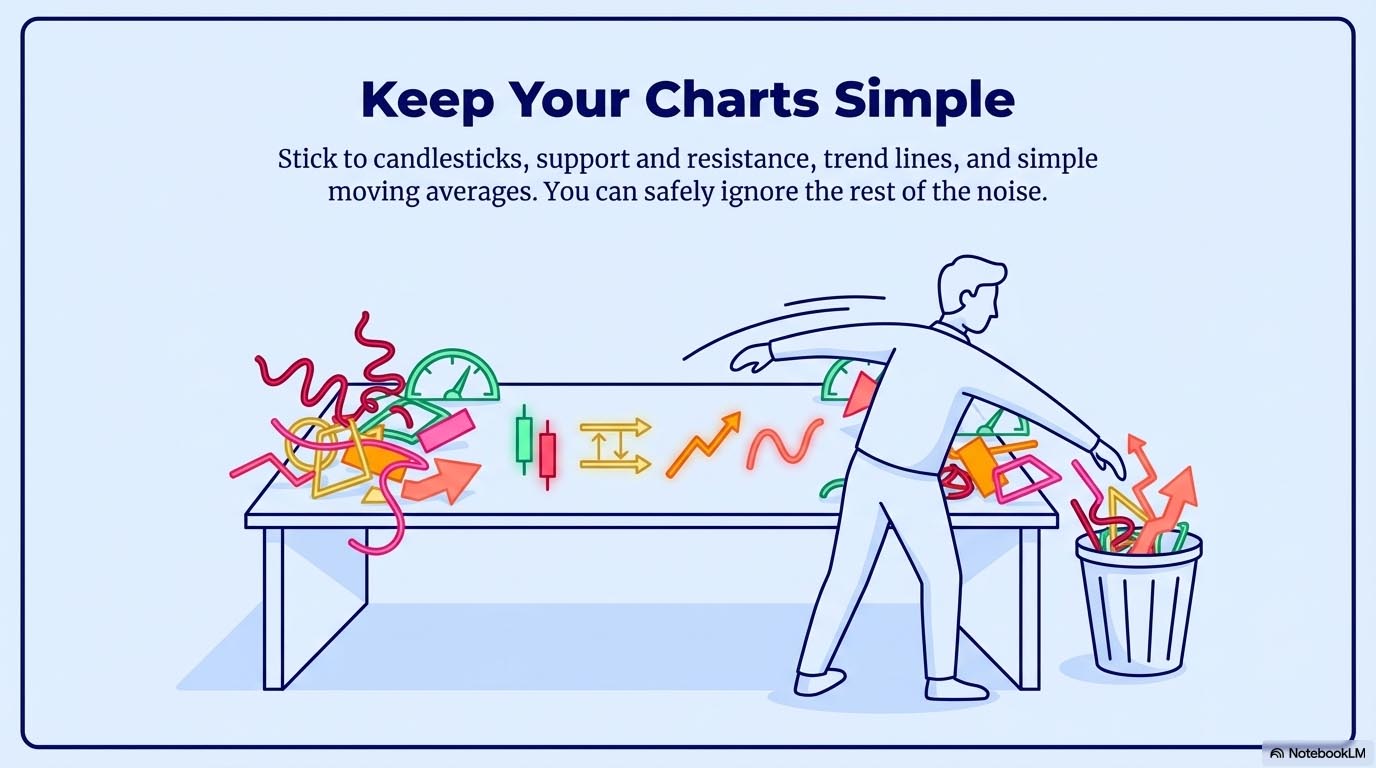
Chart Reading Essentials: The core components the author identifies as necessary for the ITM strategy, which include candlesticks, support and resistance lines, trend lines, trading channels, and simple moving averages.
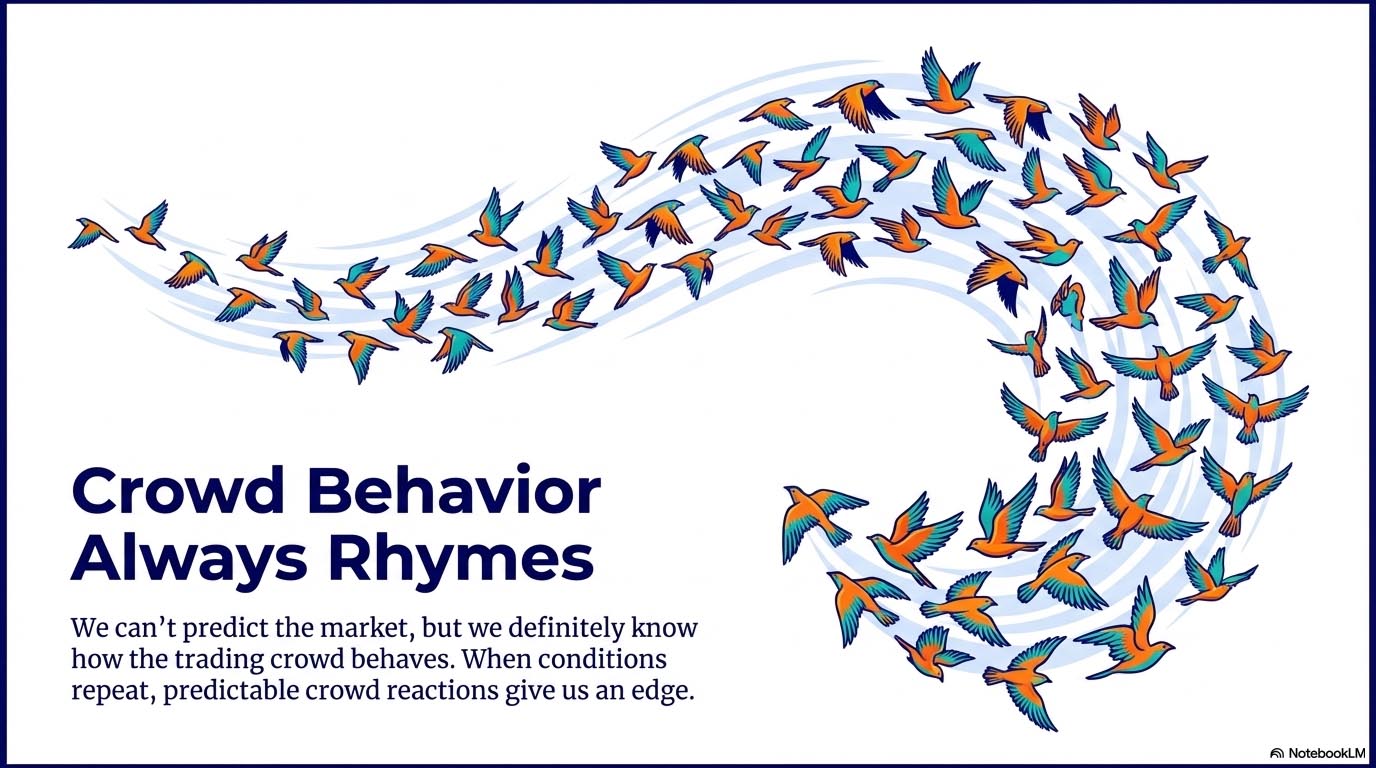
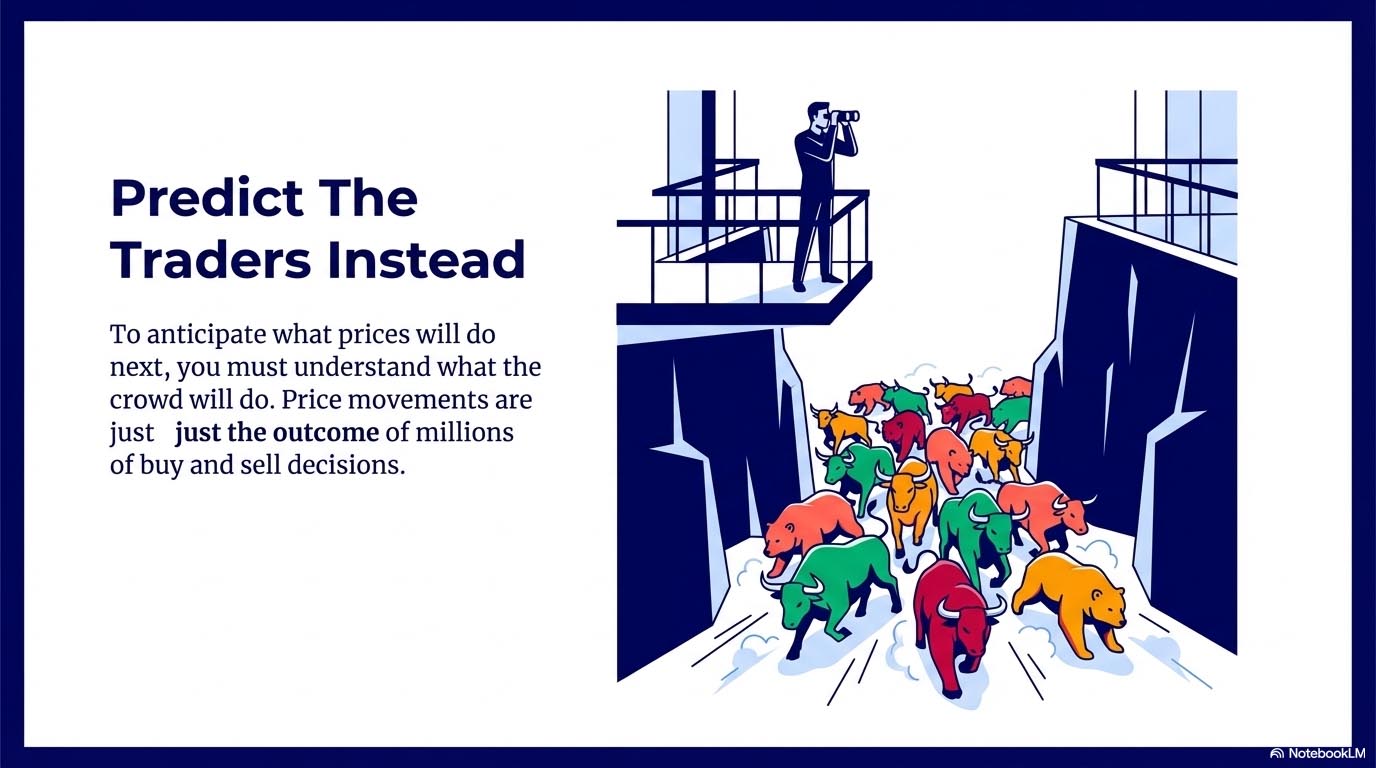
Crowd Behavior: The collective actions of market participants. While individual trader actions or future market movements cannot be predicted, the author notes that crowd behavior tends to “rhyme” when similar conditions repeat, which can give traders an edge.
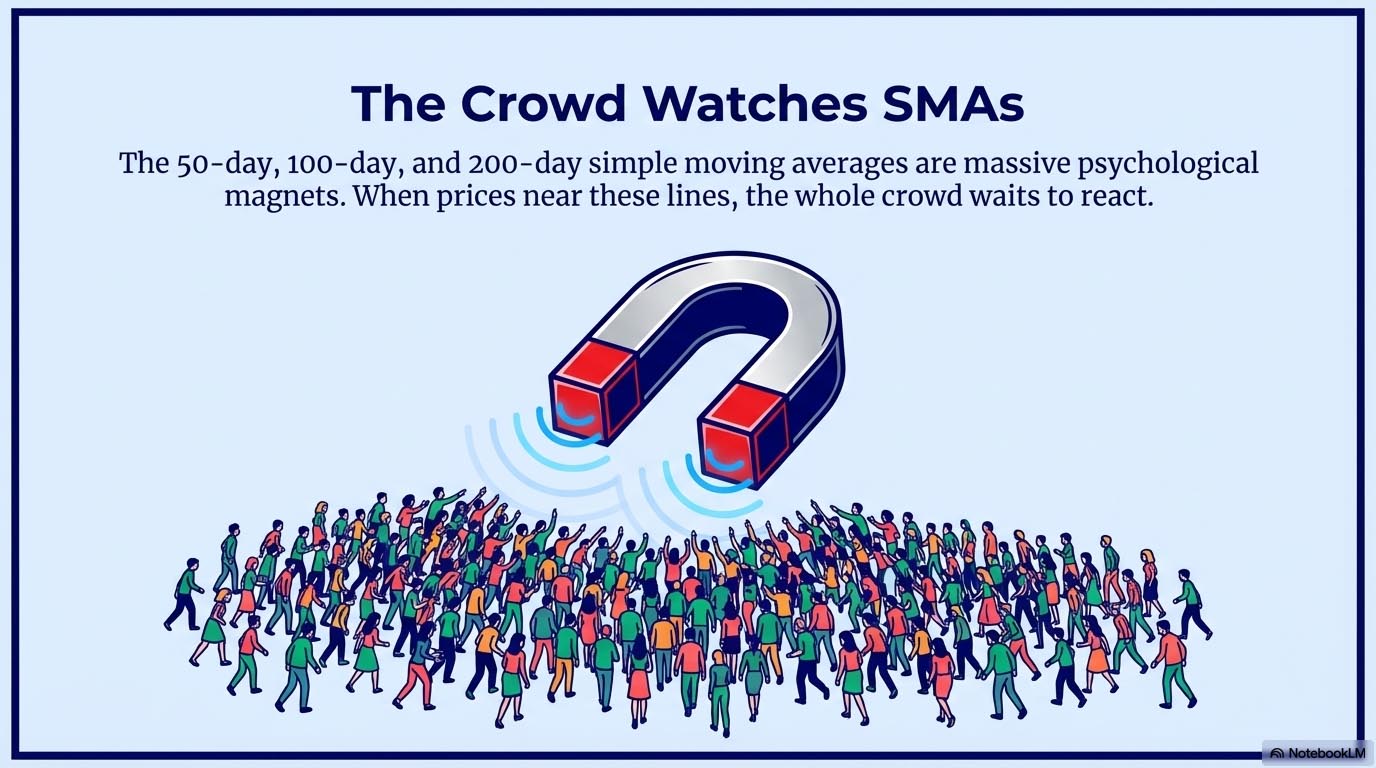
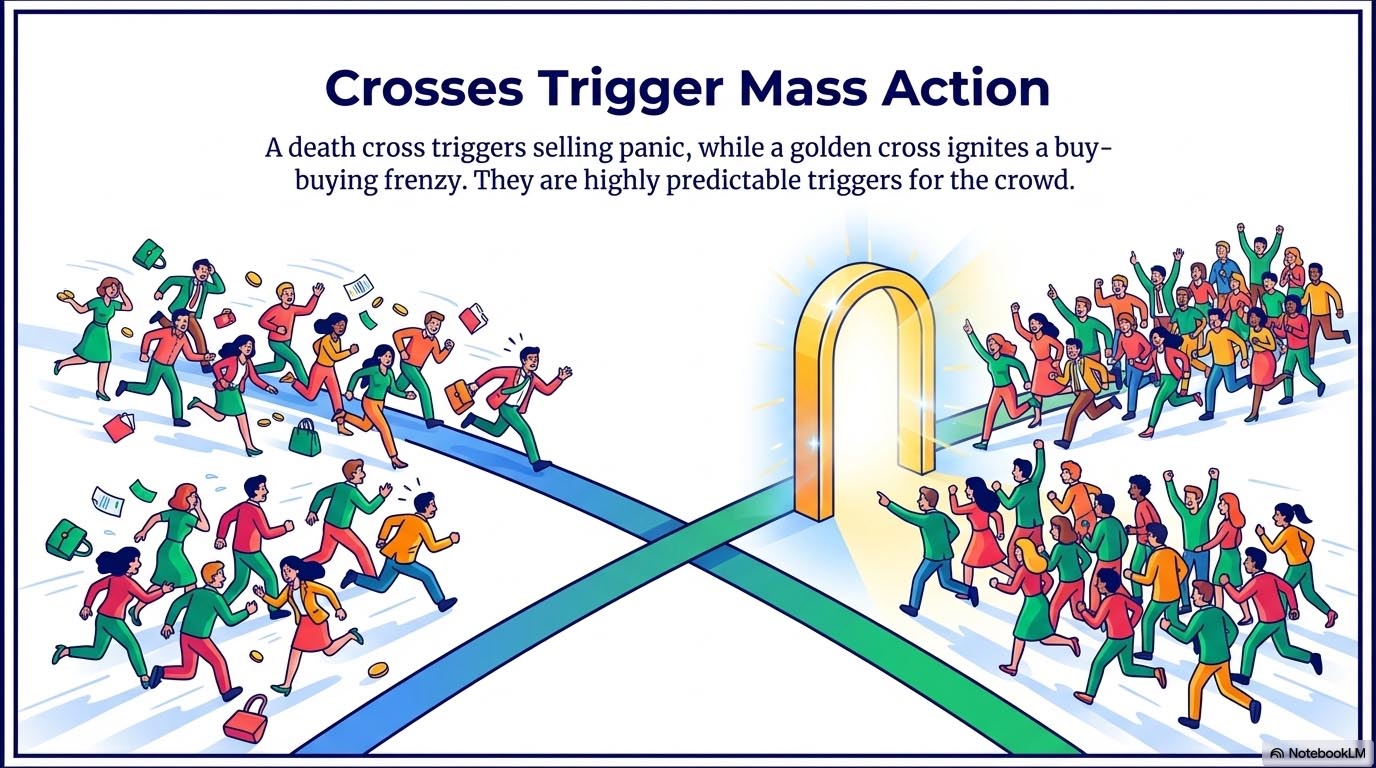
Death Cross: A chart pattern that occurs when a shorter-term simple moving average (like the 50-day) drops below a longer-term average (like the 200-day). This is widely interpreted by traders as a bearish signal that often triggers selling.
Golden Cross: A chart pattern that occurs when a shorter-term simple moving average (like the 50-day) rises above a longer-term average (like the 200-day). This is widely interpreted as a bullish signal that often triggers buying.
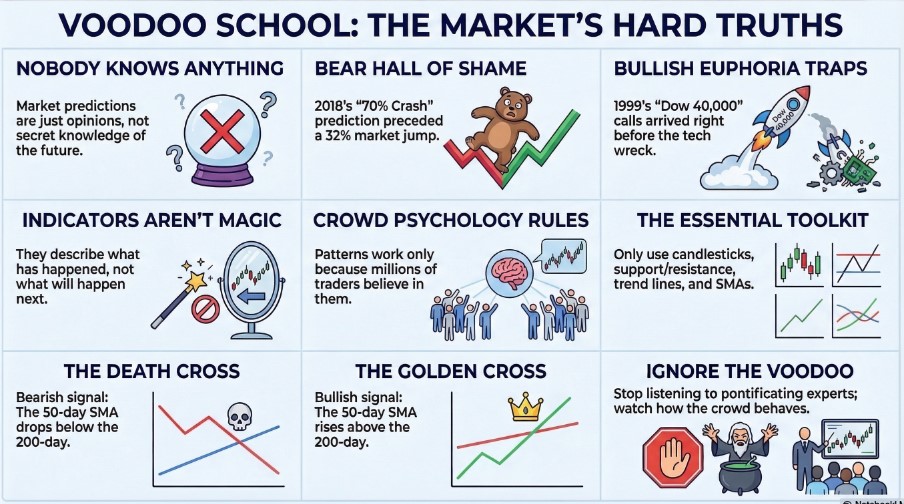
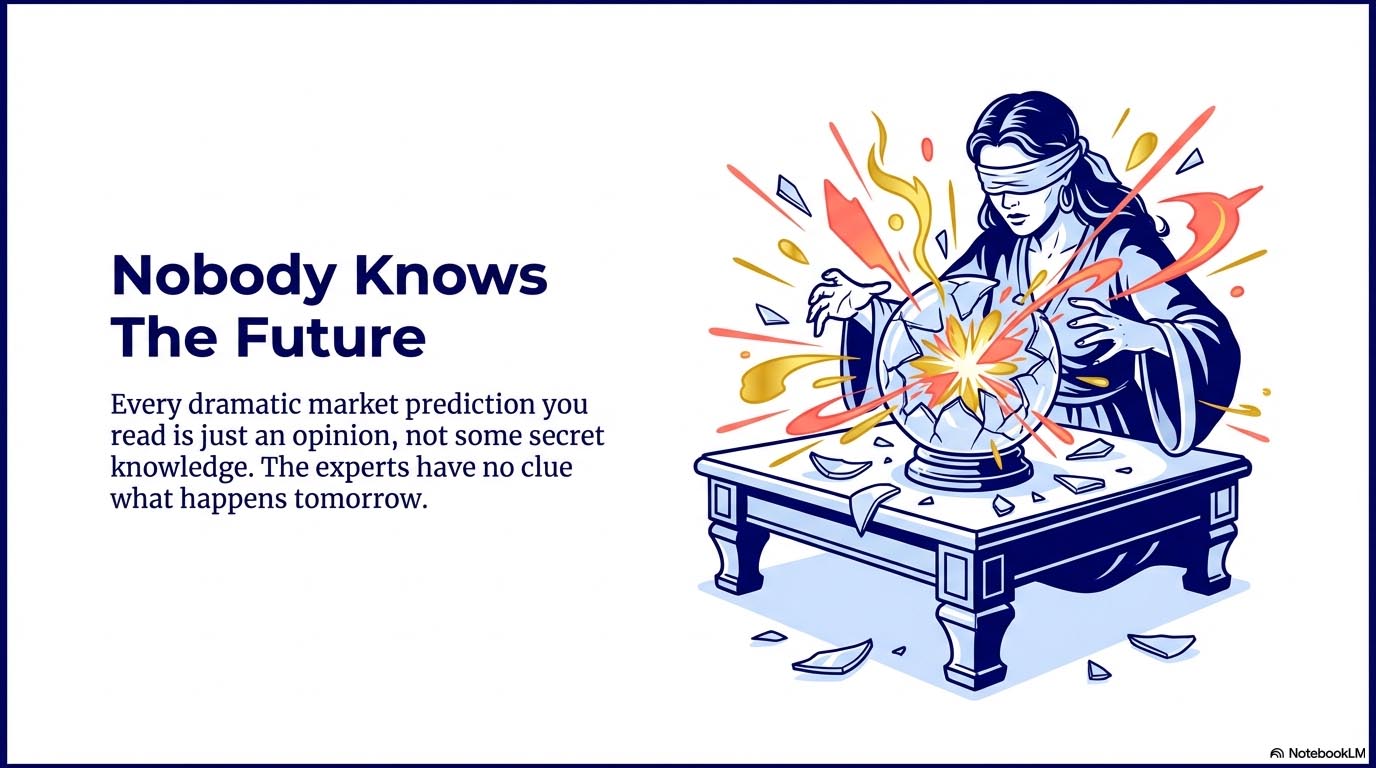
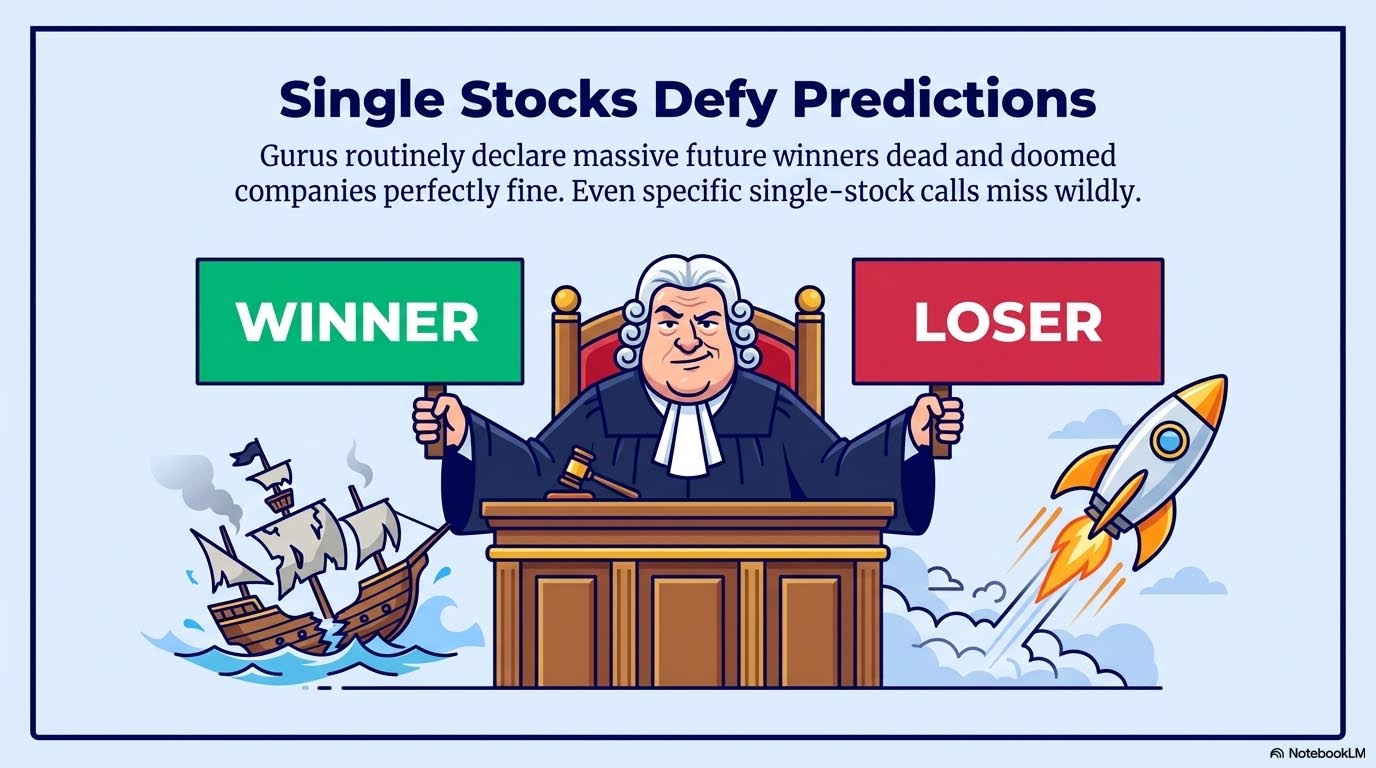
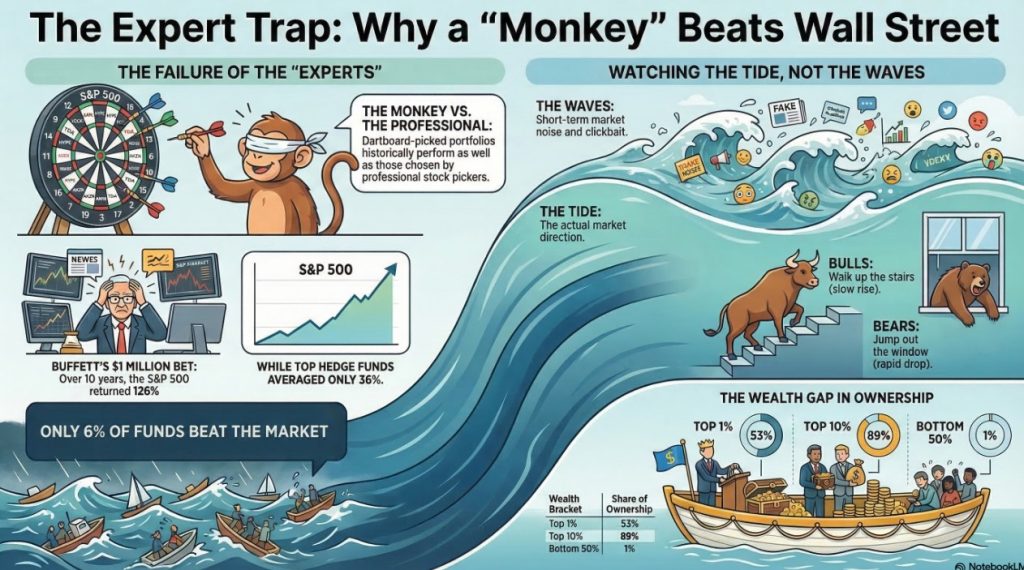
Market Predictions: Forecasts made by financial “experts” regarding what the market or individual stocks will do in the future. The author stresses that these are merely opinions, are often wildly incorrect, and should be ignored.
Simple Moving Average (SMA): A widely watched chart indicator, with the 50-day, 100-day, and 200-day SMAs being among the most common. The 200-day SMA produces a smoother line on a chart than the 100-day, which is smoother than the 50-day.
Stacked Bullish: A chart setup where the 50-day SMA is positioned above the 100-day SMA, which is in turn positioned above the 200-day SMA. Many traders read this alignment as a sign that everything is “all good”.
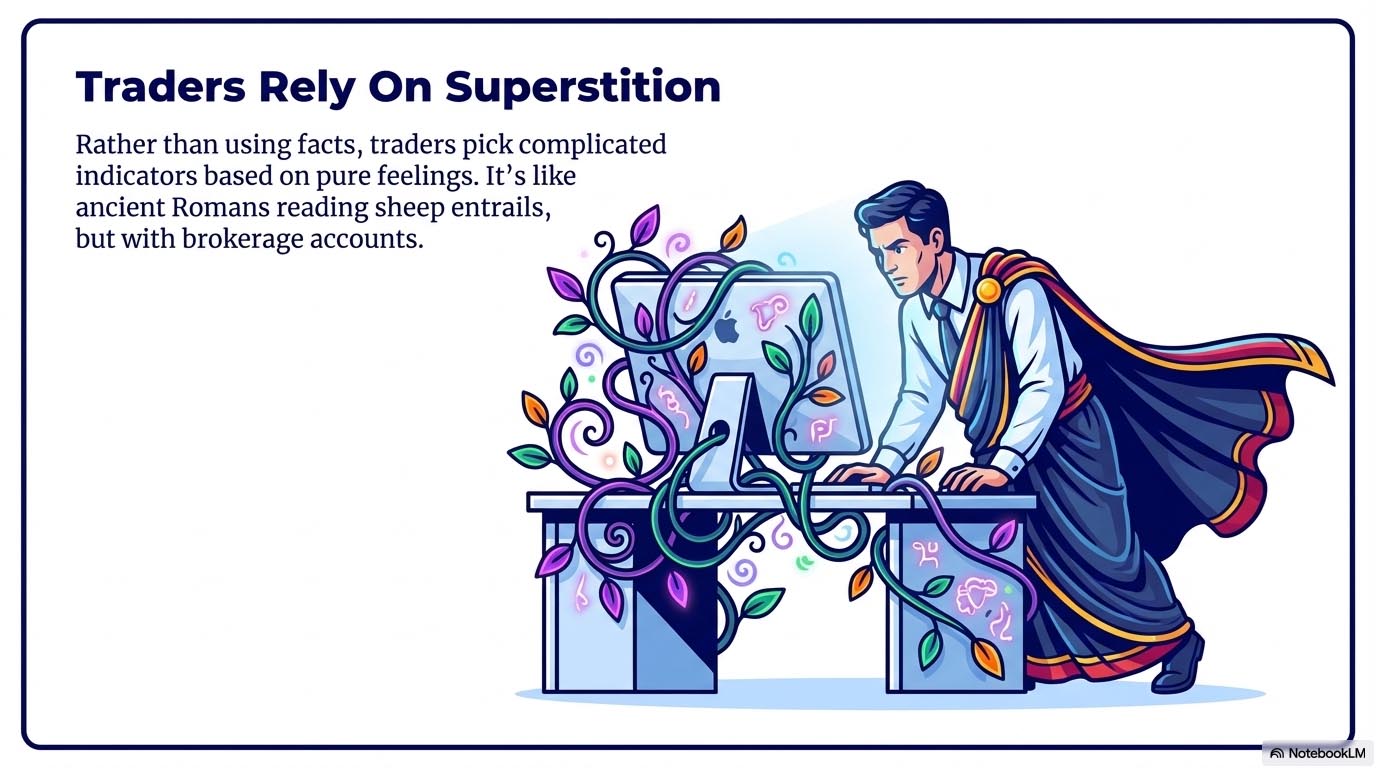
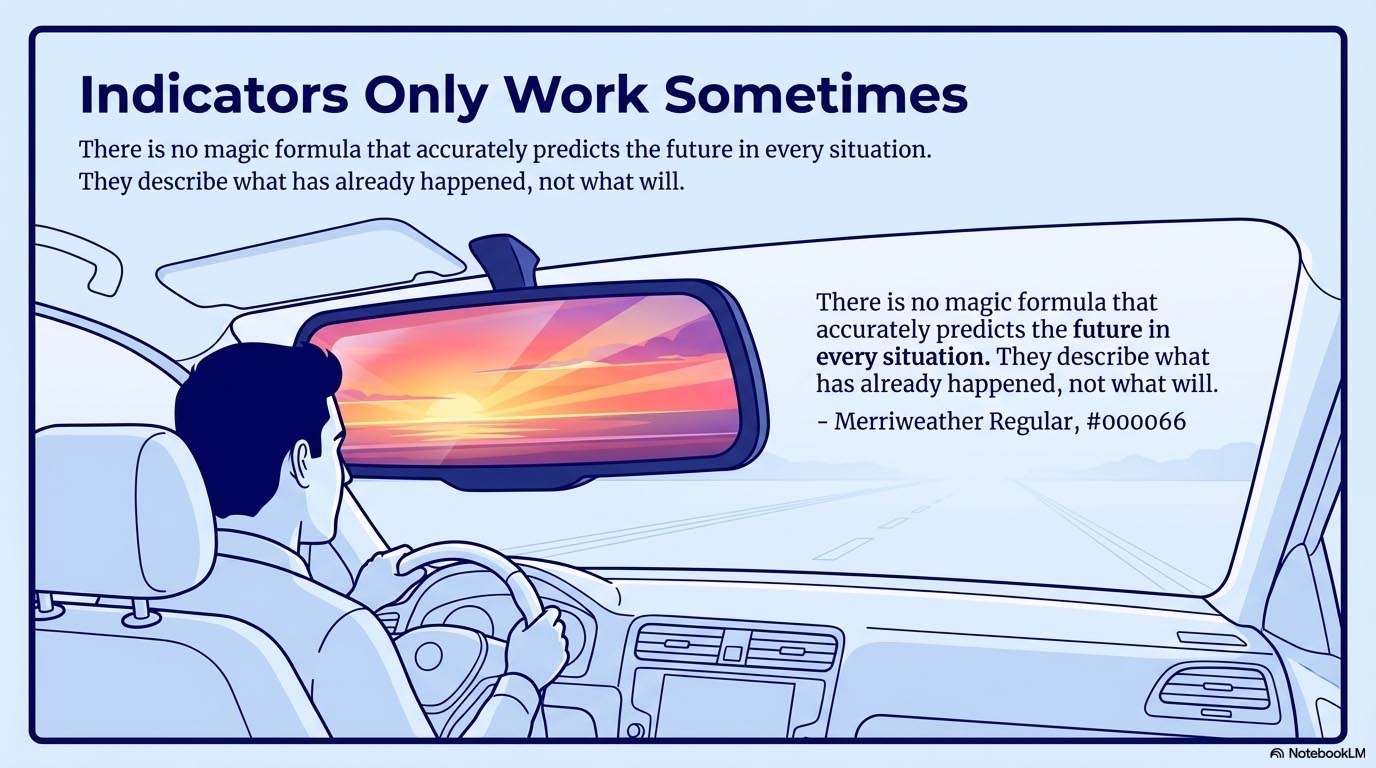
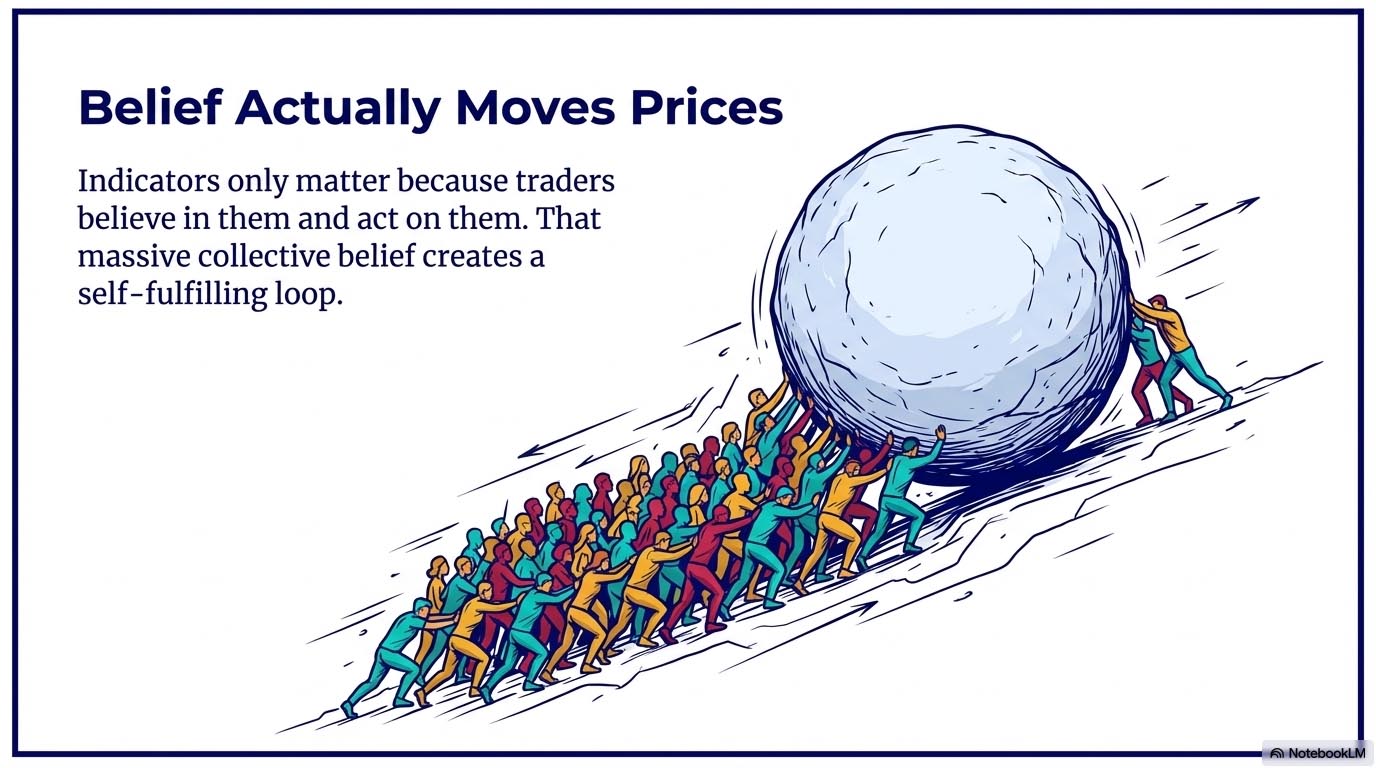
Technical Indicators (“Voodoo”): Mathematical tools and chart overlays—such as stochastics, Bollinger bands, momentum, oscillators, and Fibonacci—used by traders to analyze price movements. The author refers to these as “voodoo” because they only work some of the time and cannot reliably predict the future. However, they remain important because millions of traders believe in them and base their buy/sell decisions on them, creating a self-fulfilling loop.