


Tariff Tantrums Again!
I had planned to do this week’s blog on letting runners win – but after Friday’s drop that seemed to be in rather bad taste. Instead, we revisit the previous tariff tantrum and see if we can work out what is likely to happen this time around.
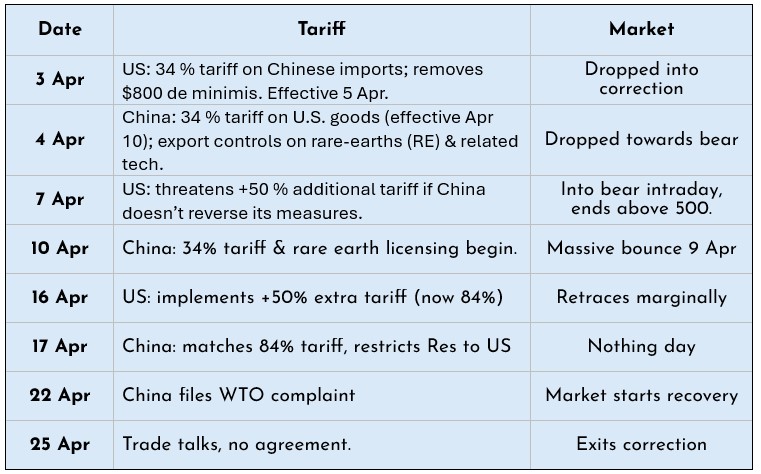
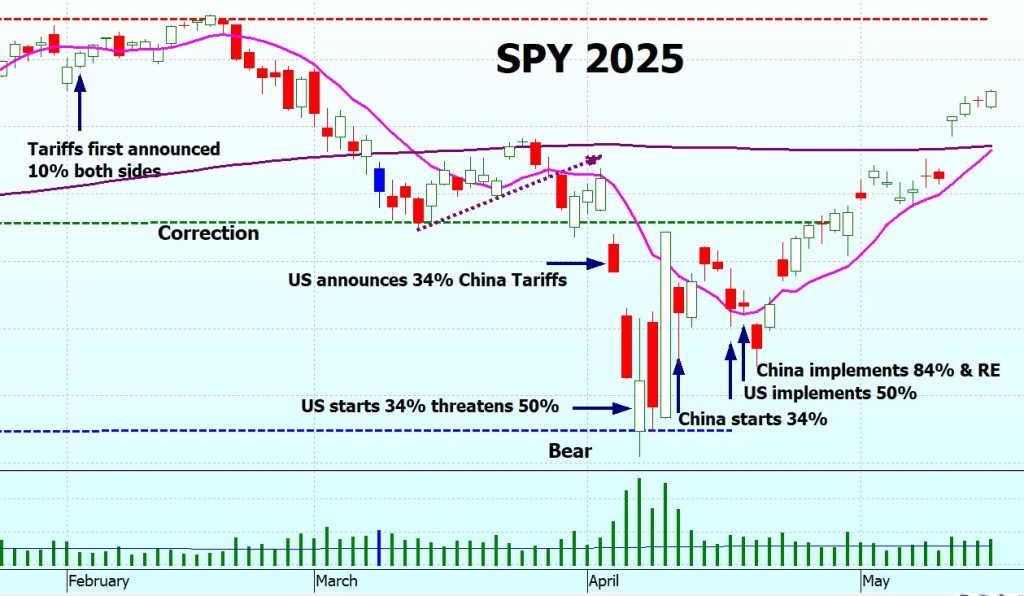
In early February the US and China announced additional 10% tariffs on each other. Initially the market was unaffected but by late February had started to slide. It hit the correction level and bounced, for no particular reason that I can work out. The bounce was short lived, and it continued sideways for almost a month. Then on 3 April the new 34% tariffs on China were announced, and SPY went into correction territory, dropping even further the next day.
Basically, since then it has been a game of tit for tat between the US and China.
Tariff Timeline: February - May
Here’s the events that led to the first tariff tantrum:
Tariff Timeline May – August
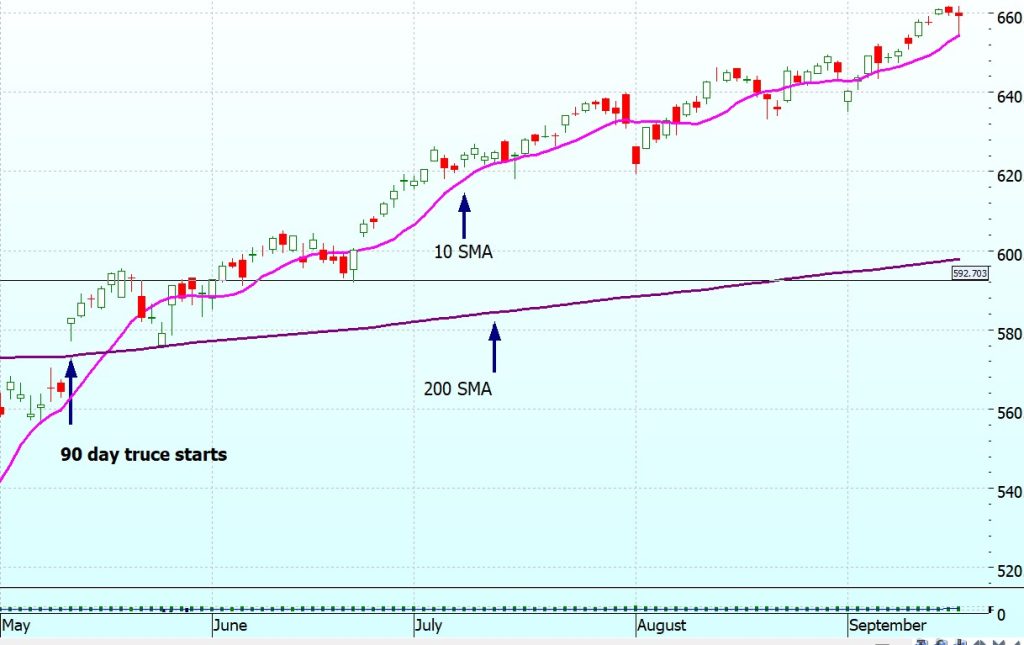
Basically everything was quiet. The stock market rose steadily with no dramas.
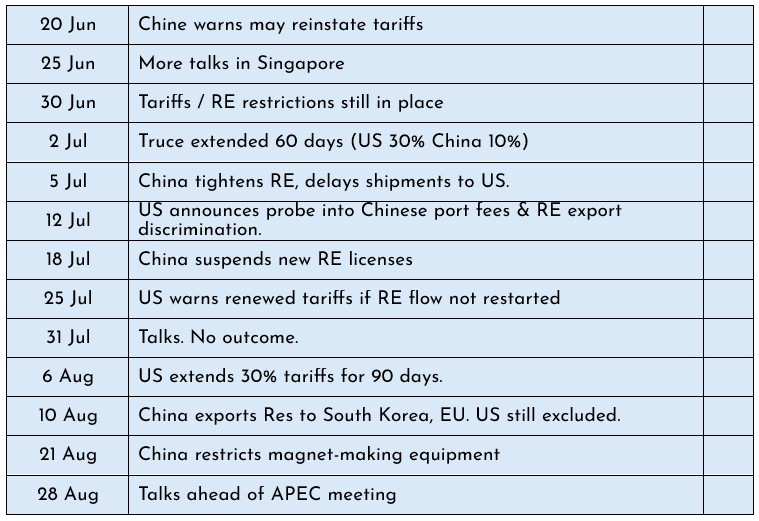
Tariff Timeline May – August
There were things going on but the market was rising steadily – until Friday with a massive drop.
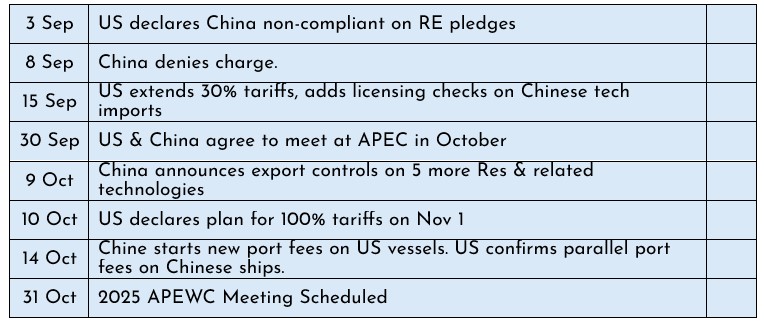
What just happened?
The 9 October China expanded RE controls and added more REs. Exporters (including foreign firms) must get Chinese Govt license to export product whose value derived from Chinese-source rare earths exceeds 0.1 %. The rules cover technology tied to RE mining, processing, magnet manufacturing, recycling, etc. Exports for military use will be denied, and those in advanced semiconductor / AI applications will be assessed on a case-by-case basis. Companies with both civilian and military businesses may be denied access to REs even for civilian purposes, e.g. Boeing. Possibly laptops and smartphones will not exceed the threshold, but motors will exceed it.
And here’s the interesting bit: Chinese firms or individuals are, for the first time, barred from helping carry out rare-earth processing overseas without permission.
Why did it happen?
It rather came out of the blue, and my first thought was ‘why now?’ It is probably that it is a negotiating tactic by China ahead of the talks at APEC. There is a fair bit of ambiguity in China’s announcements which may be to give them flexibility in negotiating – that is if they happen. The US has suggested that they may not bother with the meeting, just impose the tariffs. Probably another negotiating tactic.
Who has the upper hand?
Hard to tell. China supplies 90% of the world’s RE, but that doesn’t mean that no-one else has them, just that they haven’t developed them.

The US, on Aug 15, launched incentives for rare earth processing, but there’s a reason that China has cornered the market.
This is what an rare earth metals mine in China looks like. Can you see that happening in the US?
The US produces chips needed for AI and industrial products, which China as yet cannot produce, so the negotiations are not one-sided.
Is ITM getting political?
No, I have tried to be as dispassionate and objective as I can – but a large drop on the stock market has to be explained and taken in context. Sorry if this offends anyone!
Why are you even going there?
Because I was completely blindsided on Friday. I didn’t see it coming. I lost way more in a night than I used to earn in a year. So, I feel your pain!
Naturally we are all wondering what happens next, and as we know everything has happened before. Not exactly the same, but similar. And if we see what happened before we have a better understanding of how the market will react this time.
To the markets . .
I feel partially responsible for the current market dip. Last blog I said:
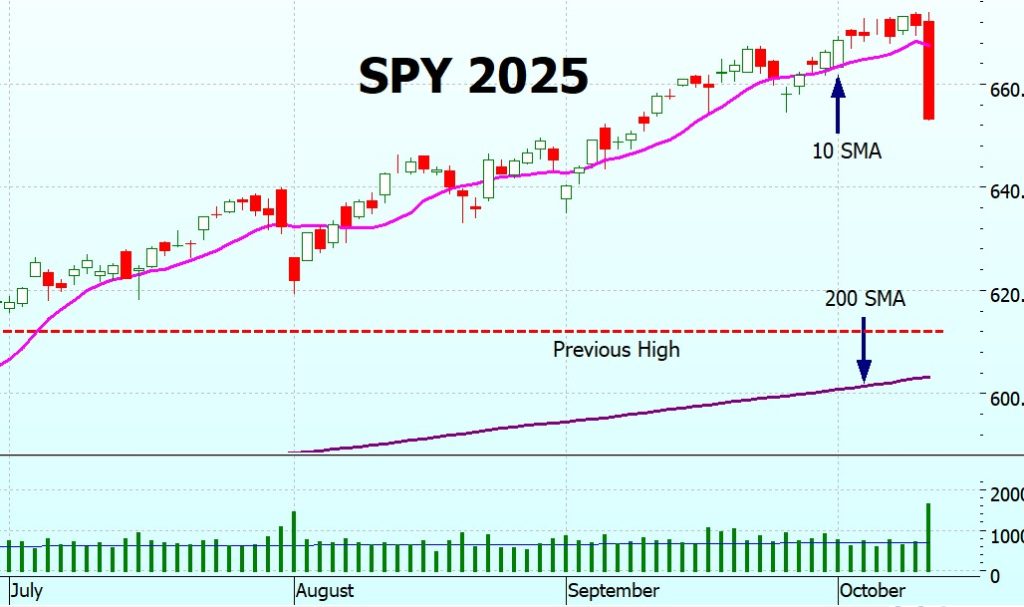
SPY still going up nice and steadily, volume also steady – nothing ominous. Can’t see anything to worry about right now. OK, I shouldn’t have said that! Tempting fate.
Damn right I was tempting fate! So, sorry about that everyone!
SPY Charts
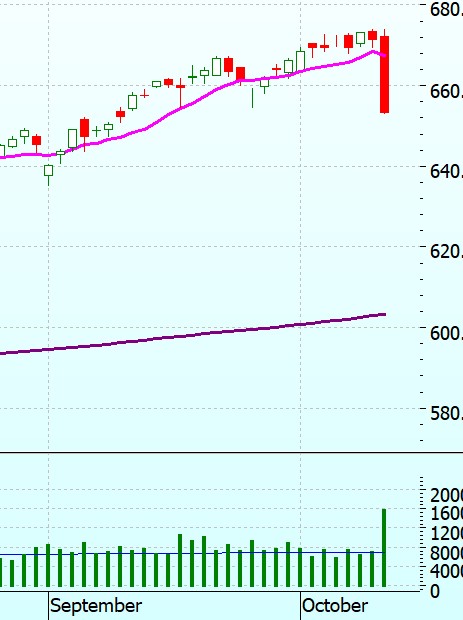
Not much to say – we’ve already seen it! But back to where we were in mid-September. I suspect that the drop was made worse by being on a Friday. And it didn’t drop right away. I was watching the market for an hour or two, everything looked normal, so I went to bed. And woke the next morning to a very nasty surprise!!
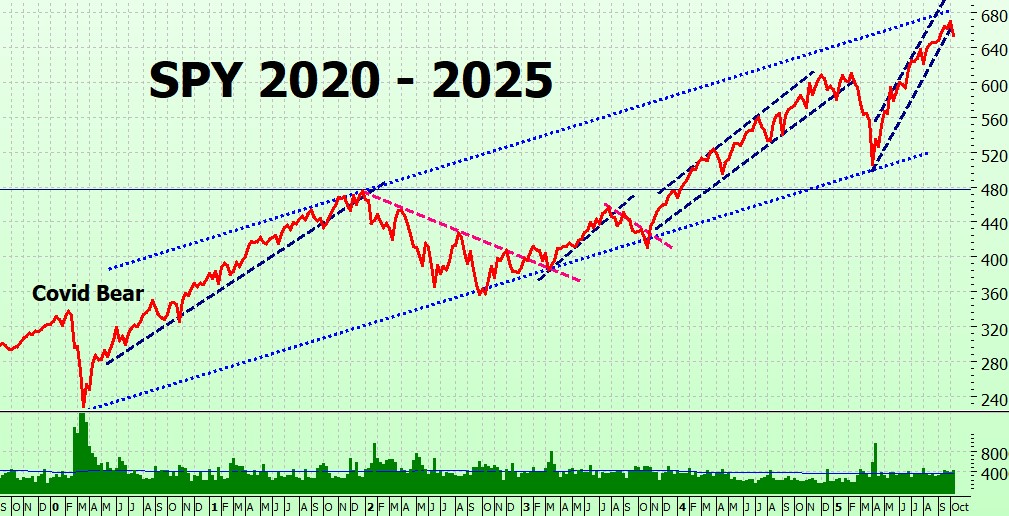
On the long term chart that pesky red candle on Friday has dropped us out of the trading range. Significant? Not yet, we have to wait and see.
SPYG Charts
SPYG has dropped in line with SPY – interesting where it has dropped to – the possible support line I drew in 2 weeks ago. At the time I said:
I have drawn in the green dashed line as a possible support line – it may or may not hold, this week will decide.
Well, now it is THIS week that will decide.
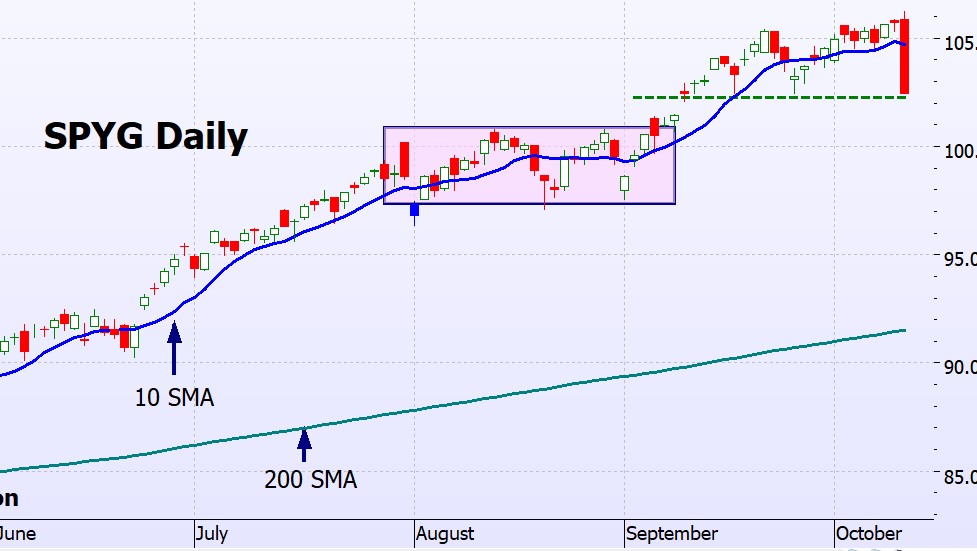
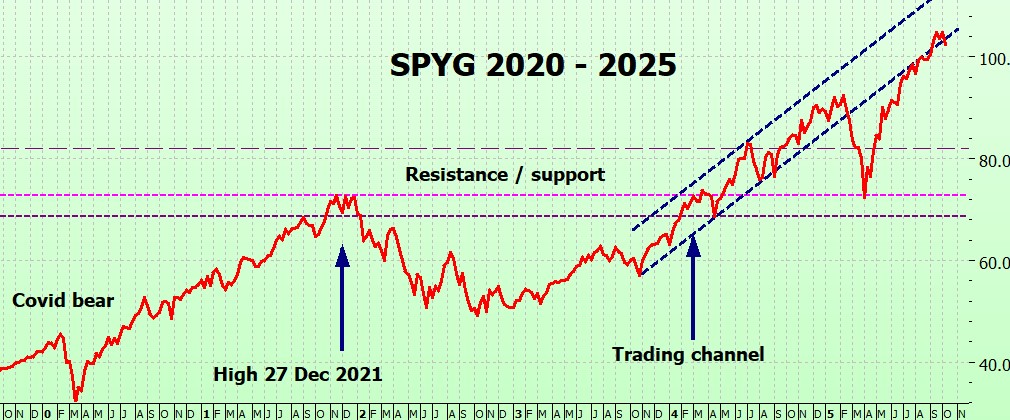
On the long term chart SPYG at the bottom of the trading range:
QQQ Charts
QQQ was more affected that SPY presumably because of its higher exposure to rare earths and China in general.
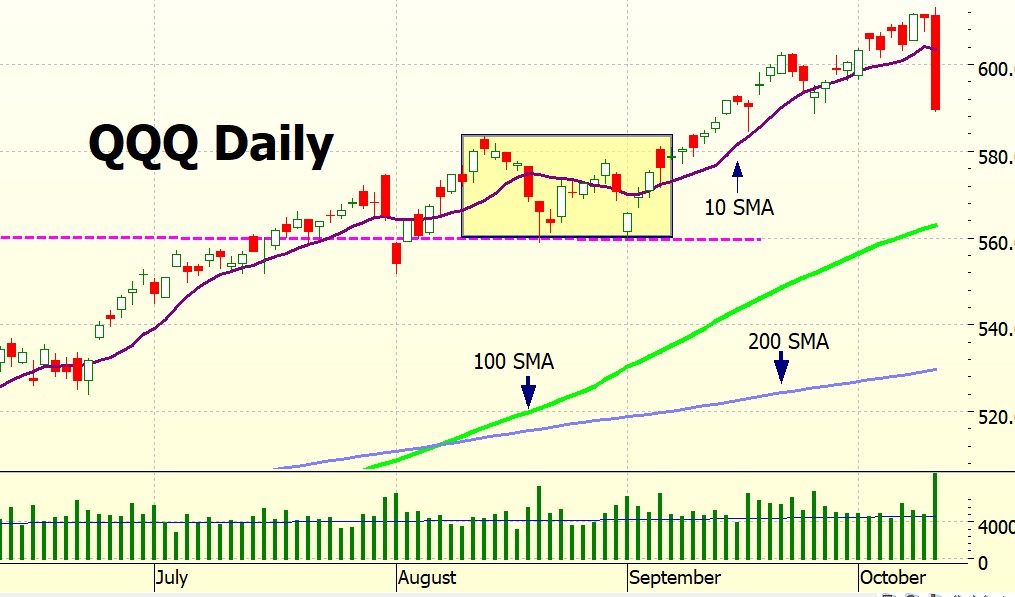
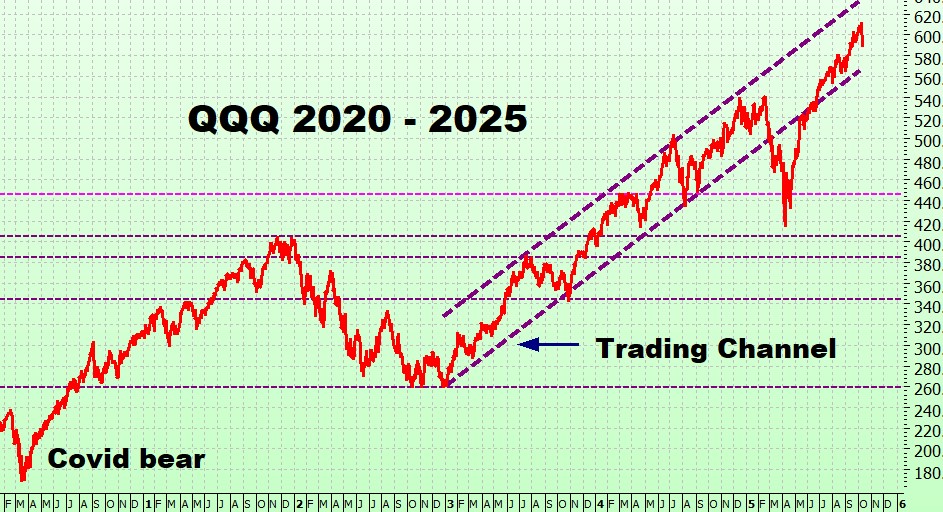
On the long term chart it is still comfortably in its trading range.
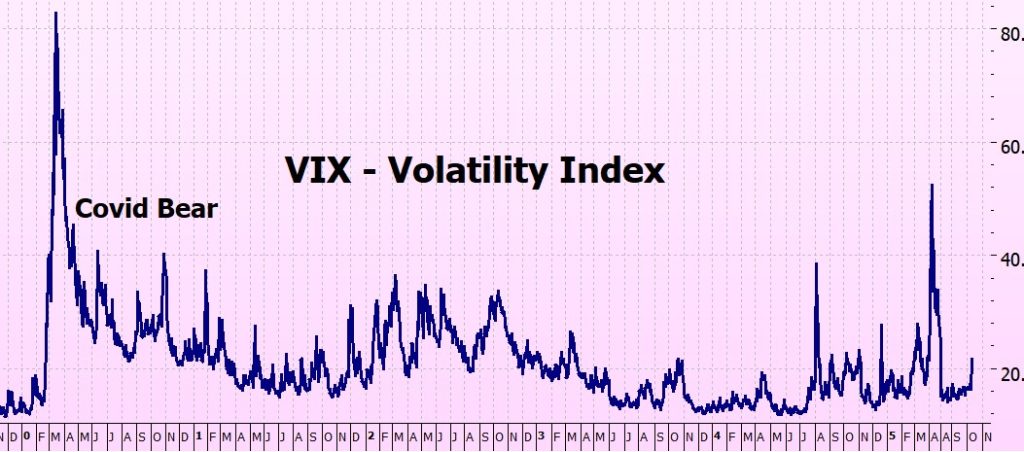
VIX Chart (volatility)
Naturally, the VIX has spiked up:
ITMeter

The week ahead. . . .
I’m not going to predict anything. On Tuesday the US and China port fees come into effect, but nothing else is formally scheduled until the APEC meeting.
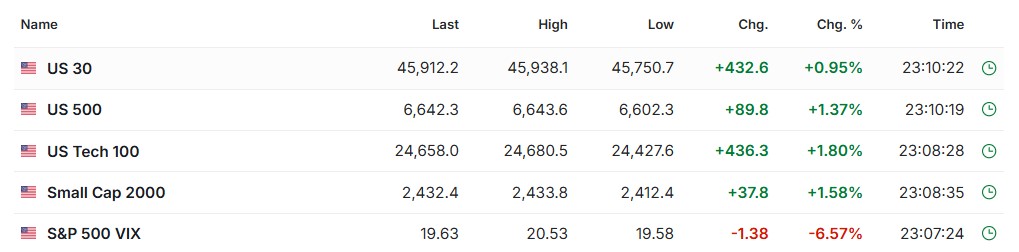
The Futures
The futures are looking rather jolly at this stage, recovering from their swoon, I hope. But still more than 10 hours to market open.
My usual refrain: why can’t everyone just settle down and play nice??
Fingers crossed for a good week!
Heather
Trade the tide, not the waves
(and that was a terribly big wave!)
Q & A
Related Posts
- Tariff Tantrums
Tariff Tantrums. I was watching market open on Friday with a sense of disbelief: The…


16 Responses
Hi Heather!
No worries at all nothing to be sorry about!!
Holding still till the Death Cross arrives. (although it is scary when SMA 200 is quite behind the SMA10
Sincerely,
John Beaver
Hey John – yes, the market will have to crash a long way before we get a death cross – I understand that. But if you have a winning system best not to second-guess it.
Been doing backtesting and am more convinced than ever that ITM is the way to go!
x
h
Hello! I just read your 2 books ITM and ITMB strategies. I really enjoy your writing style! I know you lost a bunch of money on that large drop on Friday. I’m ready to start the system. The 200 sma is a long way down from current levels. Around 9% but with leverage much more! So the question is, when do I board this train. Wait for 50 sma bounce? Wait for new signal? Start now with full or partial position? I’d just hate to get hammered right out the gate with a 25%ish hit because I’m late to the party. Thanks!
Hi Nate
the backtesting (apart from the very first trade) is based on golden – death cross so your results wont match what people who got into the trade in May will get – but waiting for another golden cross means you could be waiting years! There have been ITM trades in bull runs that have gone on for more than 3 years!
So – advice is not to second guess the market – just get in.
Obviously I can’t guarantee that the market isn’t going to drop, but I have found that waiting for a ‘good’ entry point never works – for me, anyway. Once I have decidd to get into a trade I get in.
This is just what works for me – if you don’t feel comfortable then wait – but trying to ‘catch a falling knife’ doesn’t work either!
h
Dear Heather,
Since 2016, we have been at wars with China, Russia, and Iran since the presidencies of Trump (2016-2020) and Biden (2020-2024) and Trump (2024-2028). This reminds me of presidencies of Roosevelt from 1933 to 1945.
I don’t know about others, but I don’t remember a 3% up Day in My portfolio before. Wow. Thanks to Heather for this remarkable, easy to implement method. What does the plan say? Stay invested until a death cross. Don’t make it harder than it is.
Heather in your continuing series could you address the following: options prices shown on brokerage statements. This morning when the SPY was up big, I looked at my accounts and was surprised that my position in SPYG options was shown DOWN 7.68%. I checked the SPYG itself, it was up 1.9%, I double checked my options to make sure I bought what I intended, and so on. In the end I concluded the pricing on my account was just plain wrong. I did this by opening a ticket to re-buy the position at the midpoint- which was nothing like the price on my portfolio position.
Why was I in the SPYG? I had some cash but not enough for a SPY or QQQ position. This was at Fidelity, they report that they use “industry standard pricing methods which use last trade, bid and ask”. Clearly it was not based on useful information, my guess is the last trade was quite old and no longer relevant. I am glad I was experienced enough to diagnose the issue and disappoined that I had to go through the effort, but I often think the pricing on my positions page is divorced from the underlying.
This is most likely a liquidity issue, not a problem with your broker. SPYG options have much lower trading volume compared to giants like SPY or QQQ, especially when you narrow it down to a specific strike price and expiration date.
With fewer traders, the “bid-ask spread” (the gap between what buyers are bidding and what sellers are asking) can become very wide. Brokers often display your position’s value as the midpoint of that spread.
For example, if the spread shifts from $48 (bid) / $50 (ask) to $46 / $50, the midpoint price your broker shows would drop from $49 to $48. This makes it look like your position lost value, even when the underlying asset didn’t move. It’s a common effect with options that have lower trading volume.
Hi Kate – yes, sticking to the plan is harder than it sounds! That’s what I am doing next blog on.
Re SPYG – You diagnosed it exactly right.
The “price” you see on your brokerage page often isn’t a real market value — especially for lightly traded options like SPYG. Most brokers (including Fidelity) use “industry standard” pricing, which means they’ll display either the last trade, or, if that’s too old, a bid or ask quote.
If there hasn’t been a recent trade, the last price can be hours or even a day old, so it no longer reflects reality. That’s why you can see something like SPYG up 1.9% but your option down 7%. The quote is stale — not your trade.
The best way to check is exactly what you did: look at the current bid and ask and take the midpoint. That’s the real, tradable value.
SPY and QQQ options trade constantly, so their data is clean; smaller ETFs like SPYG often show these phantom moves simply because no one’s traded that specific strike yet.
Hope this helps
h
What do you mean by SPY dropping out of the trading range? What is the trading range? I don’t recall hearing about that before and the market was far from reaching a death cross.
Hey KImbert – just the lines on the chart which provide a vitua; on what SPY / SPYG / QQQ are doing.
I mention it every week in the chart commentary?
Yes, very far from a death cross, 2 different things.
h
The only thing that matters according to the ITM rules is the 10-200 crossover. Trend lines, candlesticks, other moving averages, news, breakouts, etc. are all extra filters that don’t really add to the basics of this system but are sometimes fun to look at.
Unless the new book uses some different indicators for QQQ then I actually hope all the rest, especially the candlestick section, is removed from the new edition. Then again, it’s hard to write a good blog each week by just saying, “Yep, trend is still up. We’re good for now! ” But that really is the answer, and I think it shows the simple genius of the system.
HI Michael, I took your comment very seriously and wrote this weeks blog on it. The new book is more streamlined – for example anything that is covered in my other books is removed, and instead I am giving away a free copy of them with the new book.
Weeding out stuff that doesn’t need to be there, adding in bits about the things I get most questions about – well, I hope that I get a very focussed, easy to read book at the end. I will be taking the other ITM books off the market, this will be the definitive one.
And then I am stopping!
x
h
Dear Heather,
The sudden drop of the stock market and crypto market on Friday, October 10, 2025 reminds us to be prudent in terms of avoiding leverage money and having plenty of cash to take advantages of any market conditions. Trade responsibly and invest forever using the techniques of In The Money method by Heather Cullen and also Warren Buffett and Charles Munger.
Hey George Henry – leverage is good as long as it is controlled – hence ITM , which depends on leverage for its out-performance.
But over’leveraging? Absolutely to be avoided!
h
The trend is up, and I am long with the appropriate position size until that changes. That is the only way I can sleep soundly…..
Yes, definitely long term trend is up, hence stay long until it changes.
And I am going to sleep quite soundly tomiight – although I hope I dont get an overnight surprise like last Frida . . . !!
h