


Is It Another Tech WreckI
Everyone has it in for tech stocks right now. NVIDIA delivered blockbuster results and was still smashed. It makes you wonder: what exactly do you have to do to please this market?
Was it Euphoria?
Three weeks ago, at what turned out to be the market peak I wrote in the Blog: ‘Euphoria?’
I said I was uneasy about all the positive press, the glowing headlines and that the relentless optimism was not a good sign.


Maybe I should have said: sell everything and head for the hills! And yes, everyone would think me a genius today.
But would that have been good advice? Remember, we’re not in this for the short term.
The Bubble Narrative
Three weeks ago everyone was cheerful and revising their forecasts upwards. Today, it is doom, gloom, and bubble headlines all over again. But is this valid? If we’re going to talk about bubbles, let’s look at a real one – the actual tech wreck of 2000 – and see whether the comparison holds up.
The 2000 Tech Wreck
The period 1999–2002 was the rise and fall of the Internet Bubble. I remember it well; anything with a ‘.com’ after its name was sure to go stratospheric, and new investors were piling into tech stocks like there was no tomorrow. Some IPOs (Initial Public Offering) were ‘pre-revenue’ – in other words they had yet to make a profit! All they had was the hope of profits in the future.
The P / E (Price-earnings ratio) in tech was over 150 in many cases – unheard of today (except for Tesla, which we’ll come to later). Retail margin debt was at record levels (meaning that many people had borrowed money, and were investing ‘on margin’. Earnings growth was close to zero despite soaring prices.
In the 18 months before the crash, the Nasdaq was up 200%. There were a lot of happy investors who thought they were brilliant investors. But it all came crashing down – hard. The Nasdaq fell 78% from its peak. What can we learn from the Tech Wreck? Are we destined for another one?

The Magnificent Seven – circa 2000
Company | Market Cap (early 2000) | P/E Ratio (2000) | Share Price | EPS (FY2000) | Notes | |
Microsoft (MSFT) | $586B | 60× | $29.92 | $1.32 | Highly profitable, genuinely dominant. | |
Cisco (CSCO) | $550B | 120–180× | $35.62 | $0.53 | Briefly the world’s largest company; valuations were extreme. | |
Intel (INTC) | $400B | 45–50× | $49.47 | $1.51 | One of the few big techs with solid earnings. | |
Oracle (ORCL) | $180–200B | 100× | $20.05 | $0.32 | High growth expectations priced in. | |
Sun Microsystems (SUNW) | $150–180B | 90× | $85.63 | $0.43 | Server king; valuation far ahead of fundamentals. | |
Dell (DELL) | $100–120B | 60–70× | $40.21 | $0.84 | Massive PC leader with lofty expectations. | |
Lucent Technologies (LU) | $200–250B | 60–70× | $55.50 | $1.04 | Telecom hardware giant; collapsed later. | |
Just like today’s Magnificent Seven, these names drove the Nasdaq and S&P. Valuations were off the charts.
Triple-digit P/Es for companies with slowing growth were normal. Cisco at 150–180× earnings is almost unimaginable today.
However, revenue quality was nothing like today.
In short, the 2000 leaders had:
– High valuations
– Slowing growth
– Weak cashflow in many cases
– Many hardware/telecom names that later collapsed

The Magnificent Seven – circa 2025
Company | Market Cap (2025) | P/E Ratio (2025) | Forward P/E | Share Price (2025) | EPS (Recent TTM) |
Apple (AAPL) | 4.0 trillion | 36× | 32.1 | $266 | $7.46 |
Microsoft (MSFT) | 3.7 trillion | 34× | 33.3 | $472 | $14.05 |
NVIDIA (NVDA) | 4.6 trillion | 44–53× | 29.9 | $179 | $9.00* |
Alphabet (GOOGL) | 3.3 trillion | 28–29× | 23.3 | $300 | $10.50* |
Amazon (AMZN) | 2.6 trillion | 30–31× | 28.6 | $217 | $7.08 |
Meta (META) | 1.6 trillion | 26× | 24.6 | $594 | $8.02 |
Tesla (TSLA) | 1.4 trillion | 50×* | 172.4 | $330* | $1.50 |
Apart from Tesla, the baby (enfant terrible?) of the Magnificent Seven, the P/E ratios of these current mega-tech stocks are much lower than the triple-digit multiples seen in the 2000 tech wreck era.

Even though valuations today are high in absolute terms, they’re far more grounded relative to earnings than back in 2000.
Compared with the 2000 leaders, the 2025 leaders have:
– Huge profits
– Dominant market share
– Massive free cashflow
– Valuations elevated but nowhere near bubble levels
History doesn’t repeat – but it rhymes
The Differences Today
Valuations
– NASDAQ P/E in March 2000: 175. Many IPOs had no P/E because there were no earnings.
– Current Big Tech forward P/Es: 25–40 (still high, but not bubble-like). Massive profits and strong balance sheets.
– Price-to-sales in 2000 absurd; today it is grounded in actual cashflow.
Earnings Quality & Cashflow
2000:
– Poor revenue quality.
– No cashflow.
– Earnings projections that never materialized.
2025:
- Hundreds of billions in revenue
- Huge margins.
- Cashflow exceptionally strong.
The IPO Flood
2000: 400+ tech IPOs in a year, many pre-revenue.
Pure speculation.
2024–2025: almost none; capital market very tight. Speculation mostly in private AI startups.
Interest rates & liquidity
2000: Fed was hiking aggressively, 6.5% rates, liquidity being withdrawn
2025: Rates falling, Fed has expected to ease further. Liquidity environment is opposite.
What Could Still Go Wrong
2000 collapsed because earnings failed. Today’s risk is an earnings disappointment in AI leaders or regulatory pressure. However, market breadth is a worry; the market is highly dependent on 5–6 companies.

And we should . . .?
Recognise that there are some similarities (leadership, valuations elevated, narrow breadth), but note the major differences.
Markets rhyme – they don’t duplicate. Stick to rules, not narratives.
Remember, ITM results covered this period, right back to 1993.
(Figures above are the best I can find, but no guarantees of accuracy)
To the markets . . .
A particularly nasty week. A very big wave, the biggest since February – April earlier this year. Not a lot of good things to say.
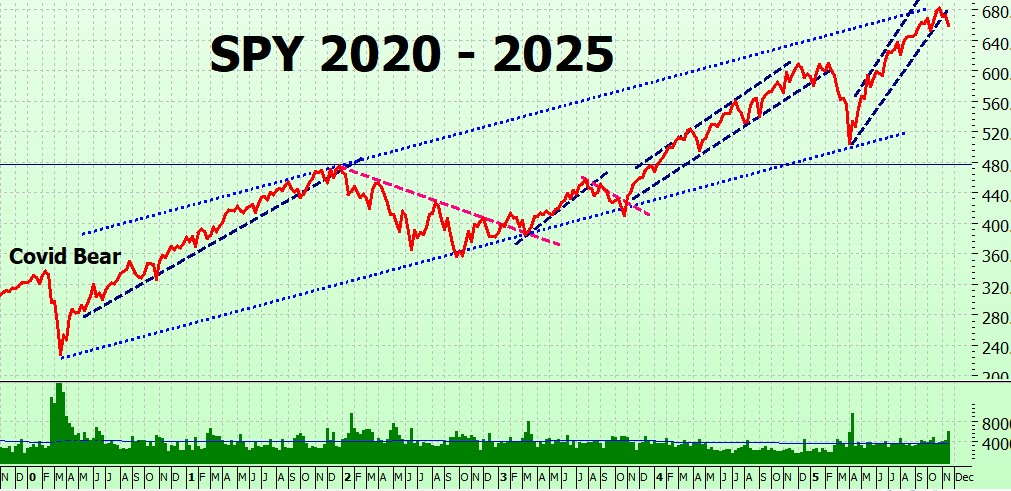
SPY Charts
The week was dominated by Thursday’s big red candle. It was quite a surprise; when I looked at the market open it was up around 2%, NVIDIA had delivered stellar results and everything looked positive, so I didn’t watch any further. When I checked after the close — egad, what just happened? The whole thing had reversed. It remains a very skittish market. If you had a dog that behaved like this, you’d book him into obedience training.
The red candle came on high volume (big red candles usually do — see 10 October) and SPY dropped below the 660 level, which I had hoped might act as support. But no — straight through to the basement. I’ve added the 50 SMA (blue) and 50 EMA (navy), as these are levels many traders watch and act on. Once SPY closed below them, we saw a series of down days — a classic self-fulfilling move.
(An aside: this is a neat example of the difference between the SMA and EMA — the EMA reacted much more quickly to the downturn.)

On the weekly chart SPY has dropped out of its short-term trading range – last time it did that was in February this year. Or, looking at it another way, it has just bounced off the top of the long term trading range – trend lines always depend on your starting point, they are not objective .
SPYG Charts
SPYG is the same pattern – peaked in late October and been falling since then. It has dropped a little more, 6.5% as it is the tech stocks that have been punished and SPYG, being a ‘growth’ fund is more heavily weighted to tech stocks than SPY.
SPYG closed on Thursday right on the bottom of the September – October Darvas box. I’m hoping it will provide support.

On the long term chart we can see that SPYG has definitely dropped out of its trading range. Let’s hope it doesn’t feel the need to repeat its February – April dip.

QQQ Charts
Tech has really been taking a hammering – it has almost given up all the gains of the last 3 months. I can’t help but think it has been harshly treated and doesn’t deserve it – but the market doesn’t care what I think! It has lost almost 8% since its peak in October which is getting close to correction territory (10% – 20%). I’ve been putting the 100 SMA on the QQQ charts recently as I have found on backtesting that it is significant. But more of that in the next book!

On the long term chart , QQQ has bounced off the upper bound of its trading channel and is almost at the lower bound. Let’s hope that it bounces off that as well!

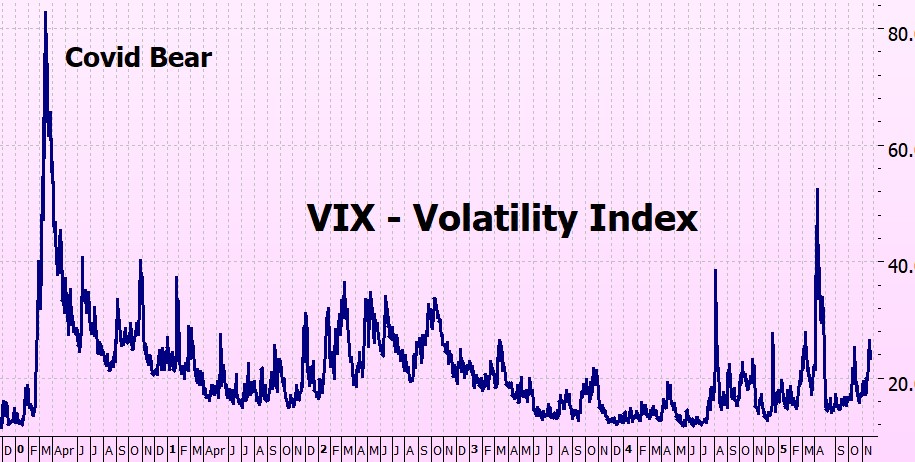
VIX Chart (Volatility)
The VIX is out of low-volatility territory – as if we didn’t know!
ITMeter

The week ahead . .
It’s a short week. U.S. markets are closed Thursday for Thanksgiving, and Friday ends with an early close – not ideal conditions for a strong rebound.
On Tuesday & Wednesday we get a batch of data (PPI, Retail Sales, Consumer Confidence, jobless claims, durable-goods) and earnings from Dell.
The 10–11 December Fed meeting is some time off, but markets are already betting on a rate cut: the CME FedWatch Tool currently shows traders pricing in a 67.3% chance the Fed will cut rates by 25 basis points during its December 10-11 meeting, up sharply from a 39.8% chance seen last week,
The Futures
The futures are up a bit – evidently the hopes of a December rate cut have been revived. It’s still 12 hours to market open.

Fingers crossed for a better week!
Heather
Trade the tide, not the waves.
Q & A
Bubble photo by Zdeněk Macháček


16 Responses
Dear Heather,
I am thinking of the valuations of the Maginificient Sevens and the top 10 companies with at least $1 trillion in market cap including Berkshire Hathaway. These companies are not like companies such as Zoom (ZM) that reached almost $600 during the Covid years and now ZM is less than $100 per share.
Dear Heather,
This week the stock market has been positive for three consecutive days now during Monday and Tuesday and Wednesday. Many times the whales and sharks are taking profits and wanting to create margin calls for the retail investors and traders who are borrowing too much to liquidate their positions.
And now four!
The big red candle is now erased (as in we are now trading above it).
A nice Thanksgiving present from the market?
x
h
Thank you for your reply.
I appreciate it very much.
Heather,
Do you personally ever use your strategy on individual stocks? I think you have said you can, but backtesting is irrelevant. I am just interested in your perspective on individual stock investing, not financial advice, but in the thought process.
Thank you,
Jason
HI Jason, no I never trade individual stocks.
I used to many years ago, but you just never know what is going to happen with them. Too much risk for me.Yes, I sometimes got it very right – but that was balanced out by the ones I got wrong. A bit of a zero sum game.
So – yes, you can use it, but you have no idea what the results are going to be. Even backtesting doesn’t make sense because of the unpredictability.
Indexes rely on mass behaviour, so are suited to the ITM strategy.
Hope this helps
h
I have been trading for years. Some years enjoyed up to 100% gain on my account, but in others slid wildly. I recently read your books, and it really makes sense. I have been using AI (Claude) to analyze your strategy, and I feel it is solid and can work. I would like to thank you for sharing your tactics and would love to hear if there are more leveraged methods such as using QQQ or such.
Hi David
I haven’t used Claude, I see that it is good for technical tasks, so I must check it out for web stuff. And yes, ’tis solid, the backtesting has been confirmed by quote a lot of readers!
Re QQQ – the new book which is coming out in January will replace all the other ITM books and includes a QQQ strategy, so hang in there, only a few weeks.
I will be giving BLOG readers access to all versions at cost price. I am feeling pretty happy about it I think it is better than previous ones, much tighter and going tohave a lot of additional material on the website to keep it streamlined.
Hope this helps
h
I have no idea what the market is going to do from here; my predictions are only right about 50% of the time, if that. But the trend is still up (10-200) and I’m holding long until it changes.
Maybe you were right a few weeks ago about being cautious, but I disagree with your euphoric assessment. I am just not seeing that in my world. CNBC is always a Negative Nancy with a Republican government and remains so. Redditors and YouTubers call for a crash every time the market declines 1/2%, so I don’t think this is euphoria at all.
Bottom Line: ITM system is long and so am I until it signals short. You have a great system, Heather. Of course, everyone can make their own tweaks, but the rationale is sound trading practice. Best success to everyone always.
Hi Michael – I didn’t mean anyone should take action – I was just giving my take on the mood of the market. It’s like being on a plane – I always follow the flight path, even though I have no influence in the cockpit!
I don’t watch CNBC – I mostly check Investing.com for major things, then read more on any topics i think are relevant. Using ChatGPT to get the market news for you always works well too. Goldman Sachs had raised its S&P year end forecast to 7,200, BMO raised theirs also tto 7,000 – and there were other articles in various websites.
I never read anything on Reddit, or watch YouTube so I think we don’t overlap on our reading!
And yes, I haven’t sold anything, hanging in their until I get a signal.
On the bright side, the last could of days have been rather nice, and the futures like quote jolly too.
x
h
Here is a link relating to the discussion lat week about Morgan
https://www.facebook.com/SteveBartlettShow/videos/1425780768393254/?fs=e&s=TIeQ9V&fs=e
Hi Kate – thnk you for that – watched it, harrowing story.
Funny, he dowsn’t look at all like I imagined – you know how you get a picture in your mind when you are reading things? Well, I was completely wrong.
x
h
Love the blog, always insightful. However, today I am confused. In the chart of stocks in 2000, looking at Microsoft, the P/E seems off, using those numbers I get a P/E of 22.66. If I use the 60 times earnings the price would be 79.20 (in US dollars). What am I missing, it is early and only on my second cup of coffee…….
Great question — and you’ve spotted the issue perfectly. The numbers look inconsistent because the price you’re seeing is split-adjusted, while the P/E ratio from 2000 is based on the actual share price at the time.
Most historical data sources (like Yahoo Finance, Statmuse, TradingView, etc.) show Microsoft’s January 2000 price adjusted for later stock splits, especially the 2-for-1 split in February 2003. After that adjustment, the original 2000 price gets divided by two — so the chart today shows it around $29–30, but the real trading price at the time was closer to $58–60, which gives you the correct P/E of ~60×.
So:
Displayed share price (today) = split-adjusted
Earnings (then) = actual
P/E ratio (then) = based on the actual pre-split share price
That’s why the math doesn’t line up when using the adjusted chart price.
In short: you’re right — and the “missing” piece is the 2003 stock split.
(And you get full credit for noticing it before finishing your coffee!)
Dear Heather,
The current bull market is only three years old which started in October of 2022. I have a feeling that the current bull market will last for several more years until the SPIndex reaches 10,000 and Dow Jones reaches 100,000 and Nasdaq reaches 50,000.
GEORGE hENTRY – i HOPE YOU’RE RIGHT!
X
h