


Options Time Value.
Getting bad reviews is part and parcel of publishing a book – don’t do it if you have a thin skin! I do take them rather too much to heart (although I am trying to develop a thicker hide) The most annoying thing is that you have no way of replying. Even if you have been misquoted you just have to suck it up.
LEAPS - again
Here’s one review that really stuck in my craw:
Prefer to Listen?
. . . she claims you can find leaps with 1% time value. That is just not true. They don’t exist. Finding 5% is very difficult. 10% is more realistic. It makes me wonder if Heather ever used her strategy.
<sigh> Where to start?
First of all, I do NOT trade leaps, and have never advised it. (Leaps are options with over a year to expiry, usually 1-3), although many reviews claim that I do.
After the 2020 edition where I recommended up to a year, I have always recommended 6 – 9 months.
But maybe he is right. Let’s check. Let’s find out whether you can actually buy options with less than 10% time value.

Definition of Time Value
Firstly, let’s review time value
Option price (premium) = Intrinsic value + Time value.
Time value is what you pay above intrinsic value for the right to hold optionality until expiration. With OTM (Out of the Money) options you are solely buying time value. If your strike is above the current price as there is no intrinsic value whatsoever.
If you buy ITM options then you have a mix of intrinsic and time. The deeper in the money you go (DITM options) the higher the intrinsic value and the lower the time value. And we are looking for DITM options with a time value of 2% or less. But do they exist?
Intrinsic Value
Intrinsic Value Is directly tied to the underlying asset, in this case SPY. For calls, if they are in the money the formula is:
Intrinsic value = (Underlying price – Strike)
Since intrinsic value is defined relative to the underlying, the excess (time value) must also be measured relative to the underlying’s price, not the option’s price. A point, I fear, my critic did not grasp. There are other reasons this is how we calculate it:
Time Decay
Time Decay (Theta) is expressed in underlying terms
- Traders, models (e.g., Black-Scholes), and Greeks measure decay as a percentage of the underlying, because the underlying drives the option’s behavior.
- If you used the option premium as the base, your percentage would be distorted — especially for deep ITM or OTM options where premium ≈ intrinsic or ≈ 0.
Comparability
It gives us comparability across strikes and expiries
- Two options with the same strike but different expiries may have premiums of $15 and $25.
- If you express time value as a % of the premium, you’d get different ratios, even though the “extra” you’re paying is fundamentally tied to the same underlying asset risk.
- Using the underlying normalizes comparisons.
Consistency
And consistency with leverage calculations
- Effective leverage = (Underlying price ÷ Option premium) × Delta.
- This whole framework assumes underlying price is the anchor.
- Measuring time value relative to premium would break that link.
SPY Example
Suppose SPY = 500, 60% strike = 300 call (deep ITM), expires in 6 months.
- Option premium = $205.
- Intrinsic value = 500 – 300 = $200.
- Time value = 205 – 200 = $5.
- As % of option price: $5 ÷ $205 ≈ 2.4%.
- As % of underlying: $5 ÷ $500 = 1.0%.

→ The 1.0% figure is the meaningful one, because it tells you you’re paying 1% of the asset’s value for 6 months of optionality.
→ The 2.4% figure looks larger, but it’s misleading: it only reflects that the option itself is already leveraged.
The Bottom Line
- Time value is best expressed relative to the underlying asset, because:
- intrinsic value is defined relative to the underlying,
- it keeps comparisons consistent across strikes and expiries,
- it aligns with risk/return and leverage calculations,
- and it avoids distortion from inflated/deflated option premiums.
But do they exist?
On P232 of the hardback 2024 edition I have a heading:
Can we find options with 1% Time value?
I calculated the 50% strike on a 1% time value, and checked as of that date (23 Jan 2024) and there was a good choice of options, which there was: at 50% – 56% expiring in June (6 months) and one in Sept (9 months). Can we find that today?
Let us check – today, 9th September, before market open prices are:
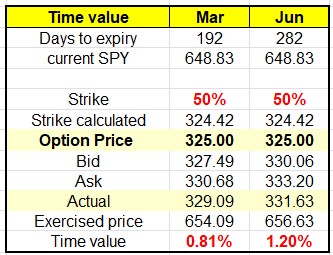
Yes, here are the options prices for 6 months (March 2026) and 9 months (June 2026)
So, a bit over 6 months to expiry you can definitely get less than 1% time value, if you want to go to over 9 months you have to pay a bit above 1%. As always, that is at the discretion of the trader.
What about 2% Time Value?
In the 2024 edition of the book I show that at 23 Jan 2024 we could get options expiring in June (6 months) for less than 2% time value up to an 84% strike. Also 9 months up to 68% strike, and 1 year up to 70% of strike.
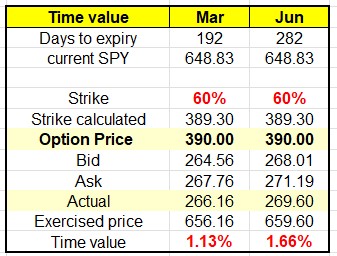
So there was no problem getting a 60% strike less than 2% time value in 2024.
Is that still the case?
Here are today’s prices we have:
Even at one year to expiry (Sept 2026) the time value of a 390 call is only 2.1%
But what about LEAPS?
The 10% claimed to be more realistic is only valid if you calculate time value wrongly, as we have seen above. But he was talking about LEAPS (which I don’t trade, never have!) here are some figures showing that the 10% figure is completely wrong.
1 year to expiry – time value 1.5%. (Less than 2%)

15 months to expiry: Time value 1.76%. (Less than 2%)

Let’s go out as far as we can – the longest dated option is December 2027 well over 2 years away. Here’s the quote:

Which is 3%, that’s for more than 2 years, a time frame I would never suggest in a pink fit. So, tell me, how 10% is more realistic?
Does Heather actually practice her strategy?
Yes, she does. She has on occasions posted snapshots of some of her accounts. Of course, she is always playing with ideas and looking for more strategies – but she can honestly say she would not have the life she does today without ITM. And she is pretty happy with her life!
To my critic . . I will resist saying ‘Yah! Boo! . . . you know the rest.

The new and final ITM book
Naturally, I am doing the backtesting and also stepping through the charts to make sure that the backtesting is absolutely accurate. I’m also going to include QQQ, and with new parameters (which are great – so much so that I’ve been over the backtesting many times checking it is accurate!) and had to calculate time values for that – hence my preoccupation with it at the moment.
To the market . .
A rather nice week, no complaints. Let’s check out the charts.
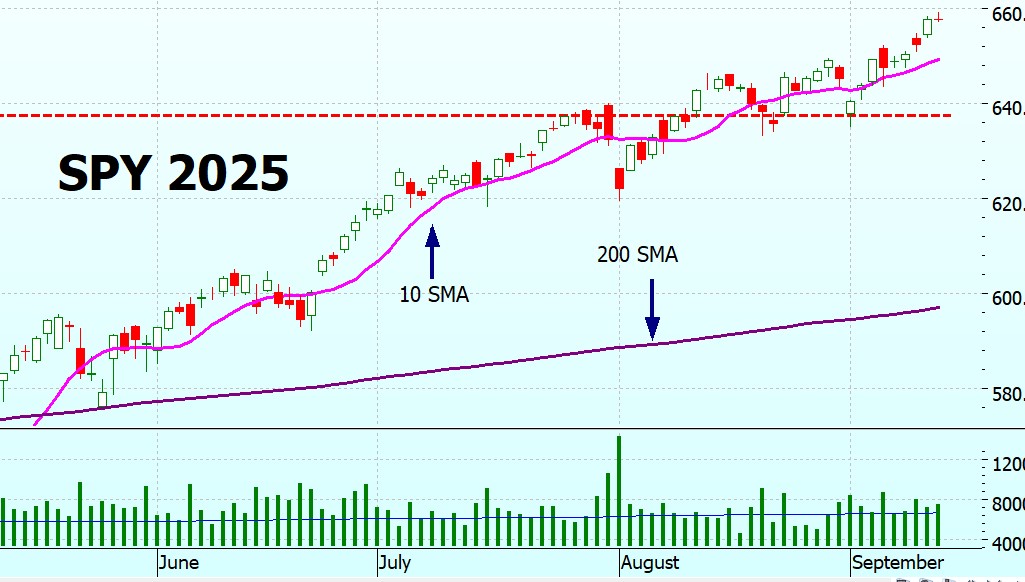
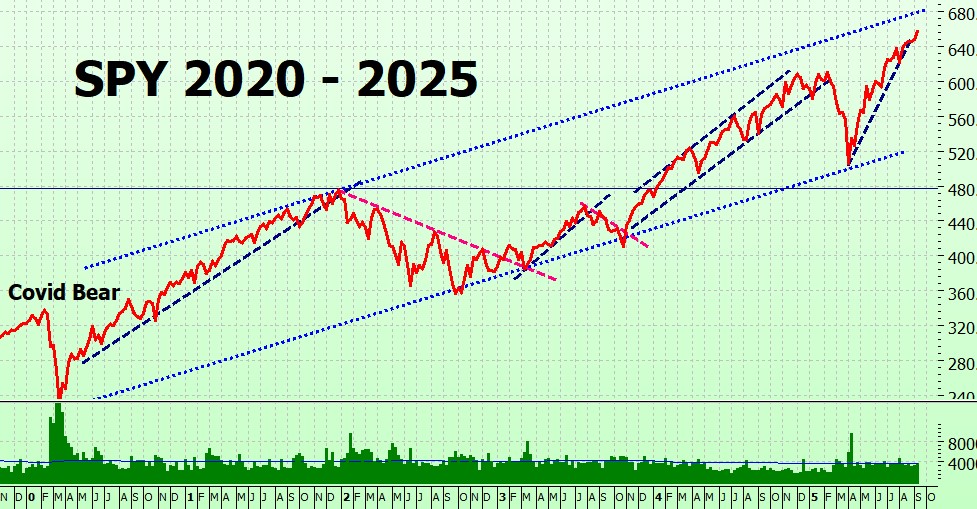
SPY Charts
What’s not to like? OK, we didn’t make a new high on Friday, but it was only a few cents below the Thursday close which was a new high. SPY is still trading on good volume, which indicates that the bulls are not yet running out of steam.
It is interesting to look at the 5 minute chart for the last 2 days – not because we are trading it, but to help us better understand market mechanics and psychology. You can see that on Thursday, SPY shot up right out of the starting blocks and was off and running with the bulls – who kind of ran out of steam after the first half hour, but it turned into a steady rise to a new high. You can see that it dropped a little in the last half hour, on high volume – this is seen frequently, traders rush to ‘lock in’ their profits before market close.
The next day (Friday) it went sideways for a bit, then rose steadily and made a new high – until the last half hour when everyone rushed to lock in their profits before the weekend. You can see the massive drop in the last 5 minute on very high volume. Does this mean anything? I don’t think so, I have seen it many times – remember fear and greed? That was just fear kicking in, people fear losing the money they have gained so dump their stocks before close. So I don’t think it is significant, it happens too often and besides the futures are not showing any drop. Here’s the 2 day 5 minute chart with volume:
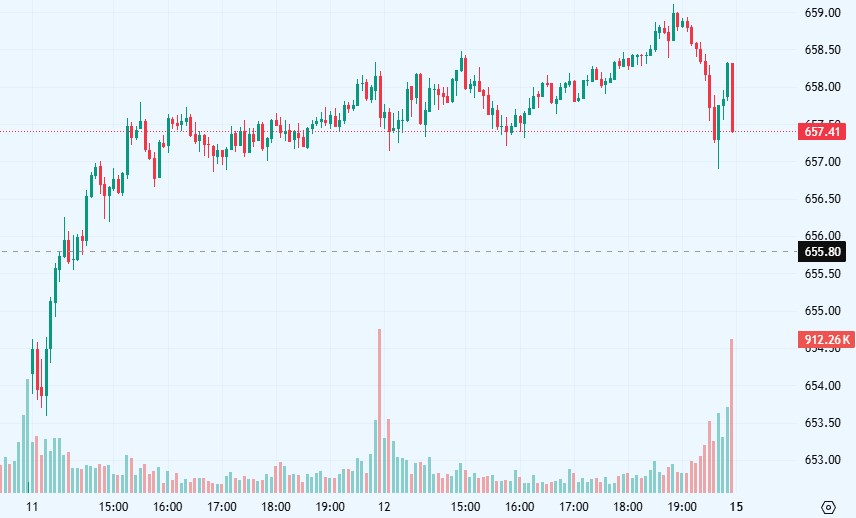
You can check my observations yourself – here is the link https://heathercullen.com/stock-charts/ , just change it to a 5 minute chart from the dropdown at the top. On the long term chart SPY is still in its long-term trading channel (blue dots) and on its shorter term uptrend (navy dashes).
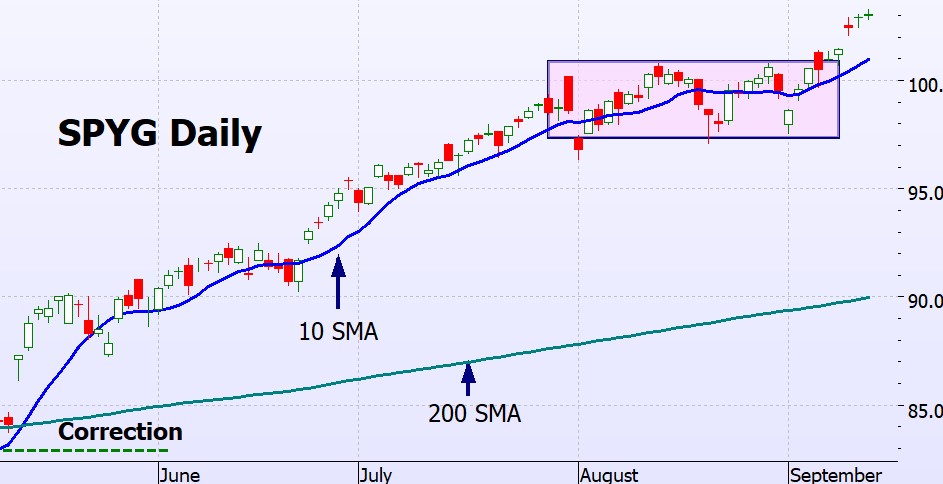
SPYG Charts
Well, good news, our Darvas box from last week was broken. We got a hint that it was going to happen the week before as on Friday 5th it broke the top bound intraday. Well, now it has definitively broken out and is continuing its upward path. Nice.
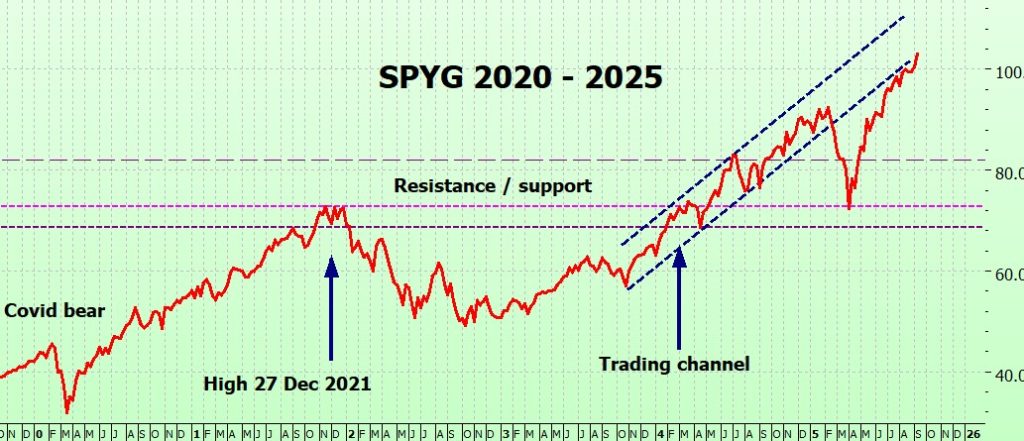
On the long term chart it looks as though it has finally pierced the lower bound and is back in its trading channel. Let’s hope so.
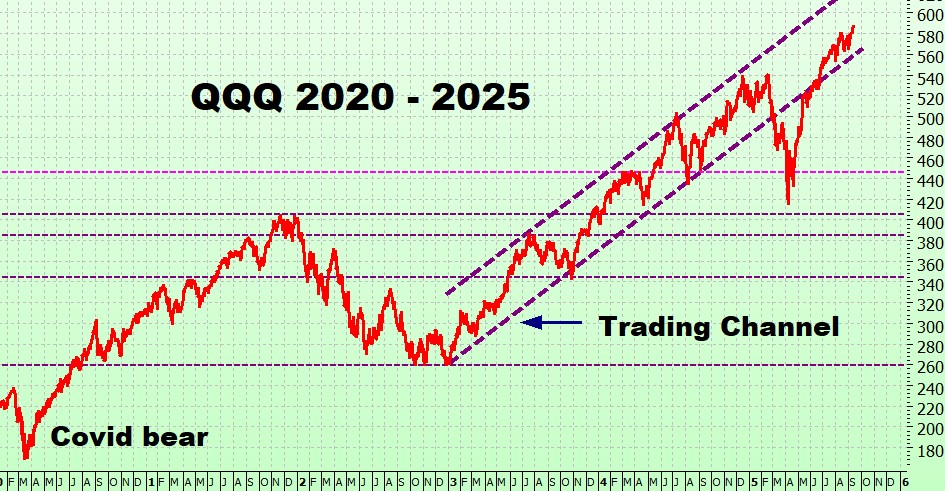
QQQ Charts
QQQ has also broken out if the Darvas box. I did say last week when I drew it that it was probably too soon to draw it – and so it proved. Onward and upward!
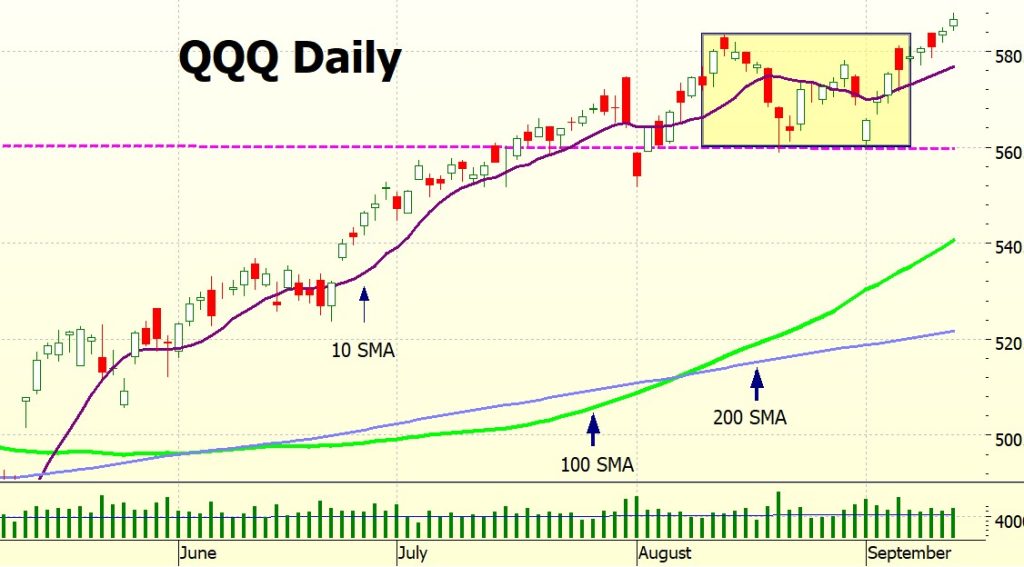
And on the long term chart QQQ is nicely back in its trading range.
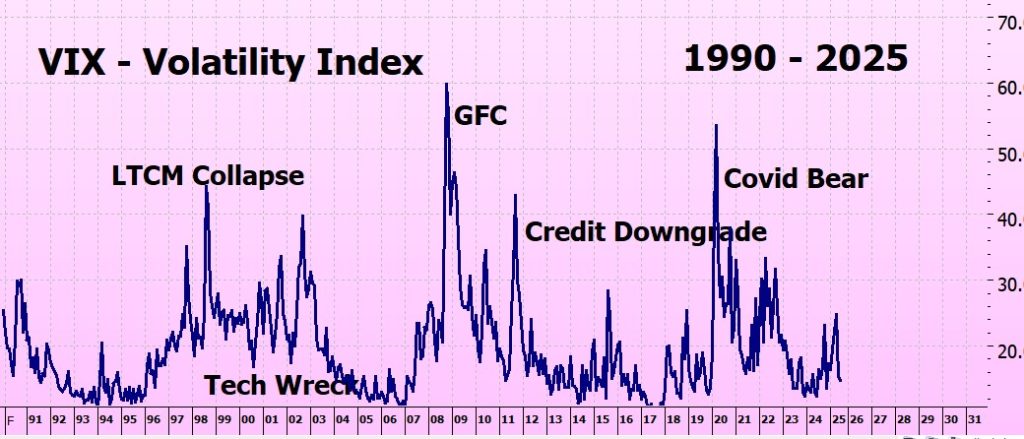
VIX (Volatility) Chart
The VIX is still in low volatility territory.
ITMeter

The week ahead
The big thing to watch is, of course, Jackson Hole, Powell is due to give the announcement on Wednesday, and it is widely expected to be a 25 point basis cut. If that doesn’t happen I am pretty sure there will be a market tantrum, so let’s hope he does. I expect Monday and Tuesday will be very quiet days as traders will be waiting for Wednesday.
It is always a double-edged sword for me; the market goes up and my USD accounts go up. Nice. But the AUD exchange rate also goes up – I have just looked it is at 66.55, up a 1.5 cents from 2 weeks ago. That’s 2.3% I’ve lost just on the exchange rate. Never mind, I was not planning on taking out any money for a couple of weeks, my guess is that is will fall again. Australia’s finances are in a terrible mess.
Futures
The futures don’t seem to be too worried, but it is still 10 hours to market open.
Fingers crossed for a good week!
Heather
Trade the tide, not the waves
Q & A
Related Posts
- Leverage & Strikes
Leverage & Strikes Why choose a 60% strike rather than a 50% strike? Why not…
- ITM April Update
Well, not only did SPY not stop at 400, it just went straight through without…


39 Responses
Hello Heather, My name is Fernando and based in New Jersey, USA. I’ve been studing the markets for the last two years and I recently came across your work. I just finished reading your book on In The Money (2024 edition), and I want to thank you for sharing your knowledge and experience. Your strategy really resonated with me, and I’m excited to start applying it in my own trading journey. I truly apreciate the clarity and detail you provided, and I look forward to learning even more from your content.
Fernando – what a lovely comment – thank you so much!
It is comments like this that keep me doing what I’m doing – makes it feel all worthwhile.
I have been very lucky to have found a way to make money on the market – and hope that other people can ‘’get lucky’ too!
x
h
Hello Heather,
I know you don’t trade LEAPS, but is there any particular reason why someone should NOT use them for the ITM strategy? If I have one option with a 9 month expiration and another option with a 2 year expiration, and we get a 10-200 crossover in 6 months, wouldn’t the shorter 9 month expiration option have experienced more dollar loss in time value than the 2 year option? Are there other considerations or reasons why you don’t recommend the longer dated options?
Thanks!
Hi Michael,
no, there isn’t particular reason just practicalities:
1) Time value- there’s no point paying for more than you need. Just checking prices (ask) for $330 strike: Jan 2026 336.74 Jan 2027 346.41 Jan 2028 aaargh dammit – no options at that strike (another problem) so checking Dec 2027 355.43. In the scheme of things I guess they are not large differences, but the main thing is:
2) Rolling Up – in a bull market you need to roll up frequently – by this I mean probably a couple of times a year – so having a long dated option is no advantage. You have to roll it up also.
As the time value of Jan 2026 330 strike is 0.8% and the time value of the dec 2027 is 3.7% (both using ask price) I just think you are paying for more than you need as you will most likely not hold it for more than 6 months.
Hope this makes sense.
h
It does. Thank you very much! 🙂
Dear Heather,
Thank you for your weekly blogs as always. Berkshire Hathaway has $350 billion in cash so it is prudent for us to have $350k or $35k in cash to take advantages of any stock market opportunities. Please dont lose money and dont be greedy.
Hi George Hentry – I definitely don’t want to lose any money, but right now I have only a small percentage in cash – just enough to trial some other things I want to test. Remember – more money has been lost trying to predict downturns than in the downturns themselves (forgot who said that, but I think he was right!).
h
Dear Heather,
Thank you for your response. The ITM Method has large drawdowns of 10% or 20% or 30% and I cannot imagine people having large portfolios such as for example of $100,000 and losing $10K or $20K or $30K while the death cross of 10/200MA is not occurring. Hence, one of the methods to hedge is to have plenty of cash to take advantage of any market conditions. Another hedging method as you have suggested is to buy SPY puts deep-in-the-money with three months expiry. Have a great Friday and wonderful weekend to everyone.
Sincerely,
George Henry
HI George – I am doing this weeks
s blog on how to protect your capital – it just depends on whether you think the premium worth it or not!
If it isn’t clear after that please get back to me.
h
I am a huge fan of your work. I am just curious, have you ever used your strategy on individual stocks. And if you did, the lessons you learned. It’s tempting sometimes to to use this strategy for stocks that are out of the price range for many people.
HI Jason – thank you for your kind words!
There is no reason not to use ITM on stocks – it is just that we don’t know what the results will be. Indexes are relatively prodictable – on the whole they go up, but individual stocks vary wildly.
However, if you are going to buy a stock anyway then using ITM will increase your profits – as long as it continues to go up!
Hope this helps
h
The confusion could have been from an inconsistency in your book that I pointed out to you last March. Repeating it here: “In Chapter 11 it appears like you changed your definition of Time Value. In the original definition in Chapter 6, it was the “extra you are willing to pay for the option, over and above the intrinsic value” divided by the ****price of the option**** times 100. In Chapter 11 you didn’t provide a new definition, but the chart in the “Backtesting Parameters And Criteria” section uses ((Effective Price – Current Price)/Current Price) * 100.” The latter is the correct TimeValue/CurrentPrice metric.
Hey Jimbert – oh, golly, i must check this out – can you let me know if it was the original edition r the 2023 or 2024 update?
I will make sure I correct it in the new book.
Thank you!
h
I have the Kindle version, and when I reopened it, it came up with a copyright of 2024. That version does not have the wording that I quoted, above, so I think I got an updated version from what I had before. However, in Chapter 6, it still clearly shows Time Value as a percent of the option price, in the bar graph examples. The equation shown for the $300 strike price option is: Option Price = Intrinsic Value (63%) + Time Value (37%). This is a valid definition of Time Value and may be the most widely used one, but it differs from the one ITM uses to determine a good strike price.
So I see two ways to fix this. You could create a new name for the time value used by ITM or you could (shudder) use the Chapter 6 definition and come up with a new value for the recommended time value. I suppose the latter would require more back testing. No rest for the wicked, huh? 😉
Hey Jimbert – I am doing the revised, updated, bull & Bear & QQQ strategy.
I will make sure I don’t make any7 mistakes this time!!!
h
“any7 mistakes”? LOL
Looking forward to the update!
Too funny!
Mea culpa!
x
h
Hi Heather, Thanks for your books and the blog, you are generous to share! Here’s a book I think you might enjoy, even if you don’t agree with everything: it’s a fast read, can be read for cheap or free at Amazon: James Ragsdale, Dow Gold Ratio Strategy. Ragsdale seems to have disappeared, but you might find old blog posts at his website (like you, he offered a free blog for a while) and some Reddit posts he made a few years back that offer a bit more of his thinking. He’s one of the few writers that advocate index funds, leverage and long term averages as indicators. Enjoy!
HI Robert – I’ve just been reading his strategy – this is it?
Data: monthly closes for ^DJI and gold spot (or GLD).
Signal: apply MACD(12,26,9) to the ratio series.
If MACD line > 0 and/or crosses above signal → 100% equities.
If MACD line < 0 and/or crosses below signal → 100% gold. Rebalance: on signal change only; evaluate monthly Rotate to gold when the Dow/Gold ratio > ~15.
Rotate to equities when the ratio < ~5. I got GPT to mock me up an excel model - this is the README: Dow/Gold Ratio Strategy Template (Excel) — MACD + Threshold Variants How to use: 1) Go to the Data sheet and paste MONTHLY data in columns A:C with headers exactly as provided: A: Date (end-of-month), B: DJI_Close, C: Gold_Close. Data must be in chronological order (oldest at top, newest at bottom). 2) The template computes: • Ratio = DJI_Close / Gold_Close • MACD(12,26,9) on the Ratio (monthly), with two position policies: - MACD>0 (equities), MACD<0 (gold)
- MACD line vs Signal line (crossovers)
• Threshold variants:
- 15/5 (go to GOLD when Ratio ≥15; go to EQUITIES when Ratio ≤5; otherwise hold prior)
- 10/4 (go to GOLD when Ratio ≥10; go to EQUITIES when Ratio ≤4; otherwise hold prior)
3) Strategy returns are computed assuming 100% in equities or 100% in gold each month with no transaction costs or taxes.
Notes:
• EMA seed uses simple average of the first N months (N=12 for EMA12, N=26 for EMA26).
• If you prefer GLD instead of spot gold, ensure the series is adjusted consistently (splits/dividends for GLD).
• You can change the band thresholds (15/5 or 10/4) on the Thresholds sheet if you wish.
• All formulas are visible; modify as needed.
It sounds interesting - but I am up to my ears in backtesting for the IITM update - I will have a proper look when it is finished.
h
I have just finished reading that book. It is simpler than what you described. It doesn’t use MACD. It only uses EMA on the DOW/Gold ratio chart to decide wheter to invest in S&P 500 or gold.
Hey Tyler – I’m getting too complicated again! Yes, the MACD probably came from some of the reviews and summaries of the book, I really shouldn’t do that, but always go back to original source.
O have been hesitant on gold since the last bull run . .2021?2022? but looking at what is happening I should have been.
But it is against conventional wisdom ATM – gold going up, stocks going up. Must investigate further.
h
Heather
Oh dear, no not at all: he advocates long term moving average crossovers on the spy to gold or qqq to gold ratios. (He would perhaps do better just sticking with 10/200, but he likes longer…)
Google “Dow to gold ratio, James Ragsdale” and you should find his book on Amazon, and possibly his defunct website.
Sorry to lead you on a wild goose chase.
Thanks for your books and the blog!
Hi Robert – I have given myself a stern talking-to today, and told myself ‘nose to the grindstone – get that book out by EOY’ – so much as I love rabbit holes I am going to forgo them for a few months!
x
h
Hello Heather, I have been trading LEAPS in conjunction with the AIM methoodology for a couple of years. It has been very profitable, but as I get to my desired retirement age in a couple of years, I have been tryiong to figure out how to reduce the wild swings in my portfolio. So I read your ITM Bull Market strategy with a great deal of interest and was very impressed. Thanks for helping me look at options in a whole new way. However, this past week, trying to put your methodology into practice, I looked for SPY call options with a strike price of either 325 or 330 and a date of later than March 2026. I was disappointed to see that for the dates with the HIGHEST open interest – namely June 18, 2026 there was literally ZERO trades during the past several days. I did not buy because I was concerned about the liquidity of the positions. I wanted to ask you if this is a consideration at all? Have you ever come across a situation where you could not buy or sell your options becuase there was no one on the other side. I would be grateful for any advice. PS – what I have seen with LEAPS in my trading is that LEAPS that are more than a year out especially with January expiration dates never have a liquidity. sincerely, Sean
Hi Sean, this is one thing you do not have to worry about.
SPY has incredible liquid options. Even if there are no trades in a particular option that day it doesn’t matter as the market makers are mandated to provide a bid / ask within mandated parameters.
Here are a couple of blog posts that explain it:
https://heathercullen.com/market-makers/
https://heathercullen.com/do-spreads-matter/
https://heathercullen.com/liquidity-and-open-interest/
So the good news is that this is something you do not have to worry about at all when trading SPY.
Hope this helps
h
Thank you Heather, very helpful. I bit the bullet and bout my first SPY option with a 305 strike and June 2026 exp date. Keeping my fingers crossed and comparing it with my LEAPS investments.
I did have another question: If I want to roll my current option to a future date (for simplicity, assume same strike price), is it better to do it on a day when the market (and that holding) is going up or on a day when the market (and that holding) is going down? Do you have any guidance around that? Thank you!
Hi Sean – it doesn’t really matter if you do theem both (the buy and the sell) as close together as you can.
If it is an upday they will both be more expensive, a down day they will both be cheaper. But since you are both buyer and seller it doesn
t really matter.
Does that make sense? PLs get back to me if it doesn’t.
h
Hi Heather,
Here’s how I think about it.
1. Since I am buying a longer dated option and selling a shorter dated option, I am putting out a cash outlay as the longer dated option is more expensive. Therefore I want the delta between the prices to be as small as possible
2. On a day the underlying sotck goes up both options are going to go up by the same %. OR maybe the longer dated option goes up by a higher %? (IS THIS A VALID) assumption?
3. In either case, since the longer dated option costs more, it is going to go up by a higer absolute amount than the shorted dated option that I am selling. Therefore the delta in prices is going to be higher, which is to my disadvantage.
4. The opposite is true on a day when the underlying stock goes down and the delta is going to be smaller, which is to my advantage.
5. therfore it is better (theoretically) to roll out – to a future date – on a day when the underlying stock is going down.
Do you see any fallacy in this logic? It off course hinges upon the assumption in step 2 above. Thanks for any insight you can provide.
best wishes,
Sean
HI Sean – I think you are right (my head started to hurt!) but I still think that the minute to minute variation is greater than the difference between the pricing of the 2 options, especially when they are not going to be very far apart strike-wise.
Personally, if I have decided to roll I just do it rather than waiting for the right conditions. Every time I try to wait for the price of something to come down it never does. Plus I am in Australia and the market opens at night here so I tend to do my trading in the first 1-2 hours, so I have to take what comes.
Hope this helps
h
Hi Heather, I have read your ITM book and am now reading the ITMB book. In chapter two of that book, you show us the two primary bear markets where the out signal was much higher than the next in signal. For the 2002/3 bear market, the out signal was at $145. You state that the buy back was at $78. In looking at the charts with the 10/200 moving averages for that period, I see that the low of the bear market was $78 and the buy back was around $92 around 4/23/03. For the 2007/9 bear market, the out signal was at $146. Again, you state that the buy back was at $68. I believe that was the low of the market. The buy back was around $94 around 6/5/09. Please let me know if I am misunderstanding something here or confirm that your figures in the book are correct. Thank you Heather. I really appreciate everything you do and always look forward to your weekly updates. Daniel
Hey Daniel – I will be going through all the bear trades in the next couple o weeks as part of the Bull & Bear update so I will look at it then. Please get back to me in a couple of weeks and I will be able to answer accurately – I am just trying to keep focussed on the new book.
Not trying to dismiss your observation, you are probably right – just need to keep focussed right now – but thank you for bringin it to my attention I will pay special atention to that trade.
h
The SPY has had a fantastic run during the past decade in nominal terms, and the ITM strategy potentiates this. However, as you correctly hint the USD has been declining in value vs. a currency basket. Returns have been good, less so inflation- and currency adjusted. It may be time to test the strategy against other benchmarks, e.g. MSCI World.
Hey Clarenc – yes, must have a look at that.
My view is colored nby the AUD / USD cross – which has (in the last few years) been very much to my advantage.
That could be changing – but I just can’t see it – the Australian economy is such a mess I can’t see how the AUD can hold up.
But that is just my opinion. Could be wrong.
RE measruing ITM against other benchmarks – I am always hesitant to introduce another variable – it adds a level of complexity which can stop you seeing what is actually there.
But a good idea to look at it – thank you!
h
The impact of the bid/ask spread is a significant factor that should not be overlooked when managing an options strategy. Based on current market data, it is common to observe spreads of approximately 0.5% of the underlying stock’s price.
This spread represents an immediate transaction cost. For instance, a strategy that involves rolling a 6-month option would require at least two transactions per year, resulting in an annual cost of approximately 1% from the spread alone.
This analysis highlights a key advantage of using LEAPS over shorter-term options. While LEAPS require a higher initial investment in time value, this cost can be offset by the need for less frequent rolling, thereby reducing the cumulative impact of transaction costs. Furthermore, this approach offers a considerable tax benefit, as holding a position for over a year may qualify profits for the more favorable long-term capital gains tax rate.
For my own strategy, these considerations around transaction costs and time decay are leading me to transition from call options to futures. The bid/ask spread in the futures market, for example, is typically just one tick—often less than 0.01% of the notional value—which makes it effectively negligible. While futures also have a “time decay” component that is generally smaller than that of call options, the mechanics behind it are a complex topic that doesn’t quite fit here.
I mention this only to share the next step in my own thought process, with the understanding that futures are a different class of instrument and may not be suitable for every investor.
I was reviewing the discussion about the time value figures, and I believe I can clarify the source of the discrepancy between your book’s example and the other reviewer’s numbers. The difference appears to be based entirely on the underlying assumptions used in each calculation.
Your figure is perfectly valid. For a SPY option with a 50% strike and 6-month expiry, the time value relative to the underlying price is indeed low (around 0.6% currently), which aligns with the ~1% mentioned in your book.
The other reviewer’s figure seems to come from a different scenario. For a 12-month SPY option at a 66.7% strike, if the time value is calculated relative to the premium paid, the result is approximately 6.5%.
So, both figures can be considered correct; they just represent different methodologies. This might be a useful point of clarification for the new book. A dedicated section explaining the different ways time value can be calculated and interpreted would likely prevent this kind of confusion for readers in the future.
On that note, I am greatly looking forward to your new book. If you are in need of technical reviewers or beta readers during the writing process, I would be happy to volunteer my time to provide feedback.
Tyler – thank you, I really appreciate the offer.
I would love for someone to check my figures, make sure all correct – because you can’t see what you cant see.
Will be in touch, but probably not for 4-6 weeks – still working out what needs to be in the book and what to leave out.
h
O no … a final book! We be Lost in the woods. A few weeks back I was looking at the channel and forgot the chart ing rules…
Jesse was my hero too but his demise wasn’t pretty. Got the ChatGPT … when it can toast a bagel / cream cheese it and make coffee then I’ll be set. Looking into gliders – keep us enlightened…
r
Hey Randy – final book – I haven’t actually got there yet, looking for a January publishing date. I need deadlines to keep my nose to the grindstone!
Gliders – I have only been in one once – but it was great, it was an aerobatic glider so we did loop-de-loop etc – so strange in an unpowered plane, no engine noise, but the wind is soooo noisy.
When we were finished with the fun stuff he said – OK you know how to do this, you can land it so I took over – and realized to my horror that I was undershooting and had no throttle!
PANIC!!
Quickly: ‘you have control you know how to do this!‘ and he did. Feathered us in beautifully.
If it had been me we would have crashed and burned.
So do let us know how you get on.
h