What we are really asking is : how long is THIS bull market going to last? And, of course, we don’t know – but we can look at what has happened in the part and figure out what is likely to happen.
The Last 40 Years
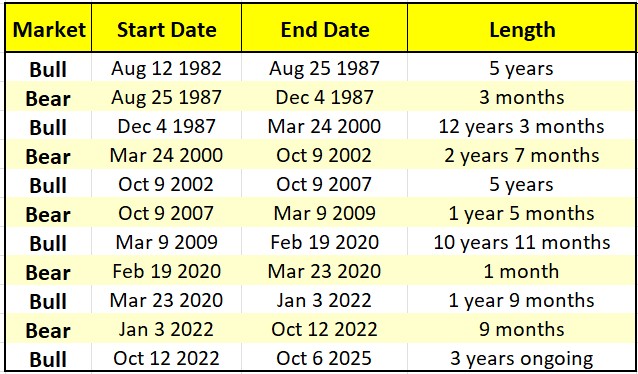
Going back to 1982 (so that we include the Black Monday of 1987) we have 6 bulls and 5 bears. Which is pretty obvious: naturally a bull market is followed by a bear which is then followed by a bull so there will the same number of bulls and bears. So how come the market goes up over time? Let’s investigate. Here’s a list of the bulls and bears:
Life Expectancy
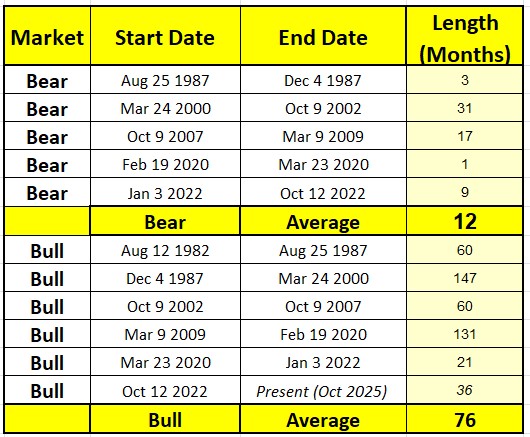
As you see, every bull is followed by a bear and every bear by a bull, so there are always equal numbers of bears and bulls. But let’s check out how long they last:
The contrast is striking. Bear markets typically last around a year (though they feel longer), while bull markets average more than six years. That means we spend roughly six times as long in bull markets as we do in bears.
Bear Falls
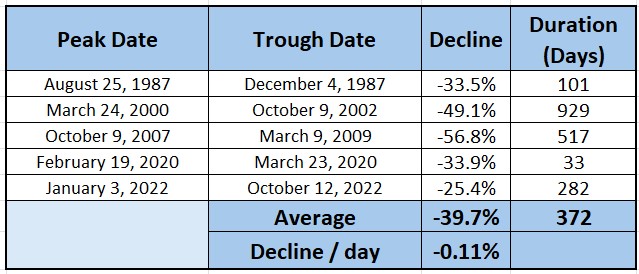
Now let’s see how much bears drop. Looking at the declines, from peak to trough, not from the start to the end of the bear market:
The average bear fall is almost 40% – nasty. And falls last, on average, just over a year. That’s something you don’t want to be in the market for if you are doing a bull strategy. It’s also interesting to look at the average decline per day – 0.11% during the fall. Let’s see how it matches up to the bull markets.
Bull Gains
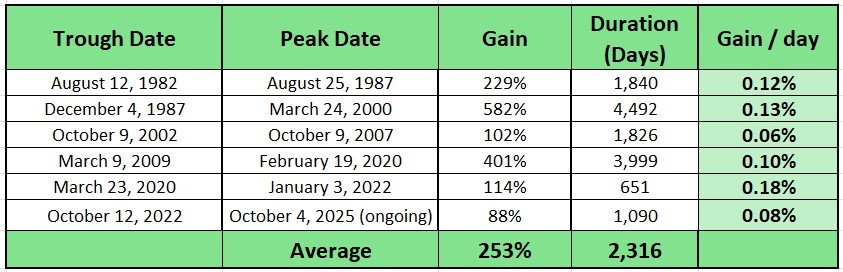
This actually surprised me. Its a market ‘law’ that bears fall faster and harder than bulls rise – but look at the figures!
I have actually never looked at these stats before, and find them really interesting. The current bull market has the second lowest average gain per day of all recent bulls, so we are hardly in a raging bull market. The only one lower was the pre-GFC, and remember how everyone was going on about how much it had risen and how overvalued it was? A baby, compared with the others.
It feels wrong, but the figures don’t lie. At least I hope they don’t – if someone wants to check my figures please do!
Why does the market go up?
We know that the market goes up – not every year but most years. Why?
Because we spend more time in a bull market that in a bear market. How long do bull markets last? More than six years. Is this bull going to last 6 years?Who knows?
I know that once a bull market has been going on for around a year I get lots of emails saying we’ve made profits, shouldn’t we get out? But maybe this will calm us down. Next week we’ll look at the biggest bull markets – both over 10 years – and see how they unfolded.
To the markets . .
Rather a nice week – rather unexpected, as I was expecting some shenanigans over the government shutdown but the market went ‘meh – seen it all before’ and ignored it. Let’s check the charts:
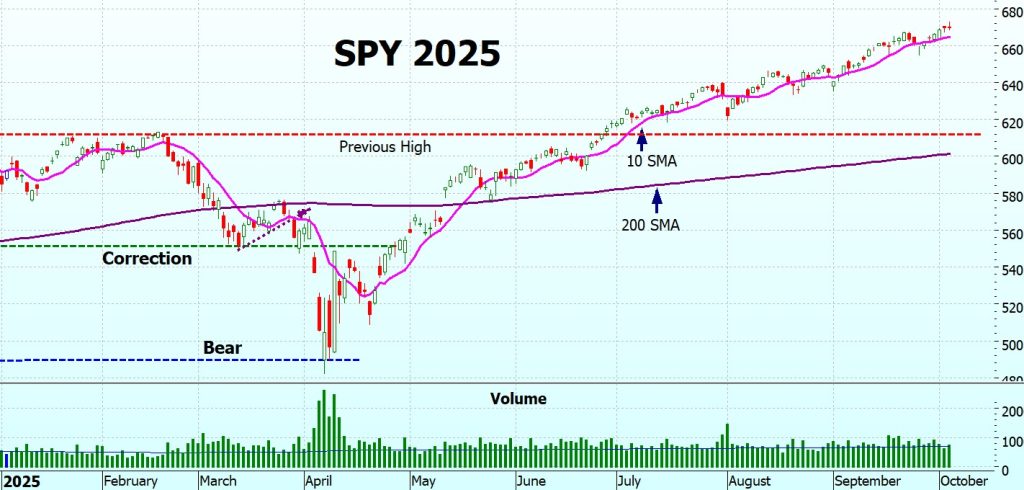
SPY Charts
I thought that since we were looking at bulls and bears we should look at this year in its entirety. You will remember the correction earlier this year, and how it narrowly avoided turning into a bear Look how accurately it bounced of the bear threshold! It flirted with bear territory intra-day but closed almost exactly on it. I am always amazed at how the market – made up of millions of traders all doing different things – can manage to repeat itself so precisely time after time.
SPY still going up nice and steadily, volume also steady – nothing ominous. Can’t see anything to worry about right now. OK, I shouldn’t have said that! Tempting fate.
“The main purpose of the stock market is to make fools of as many men as possible.”
Bernard Baruch
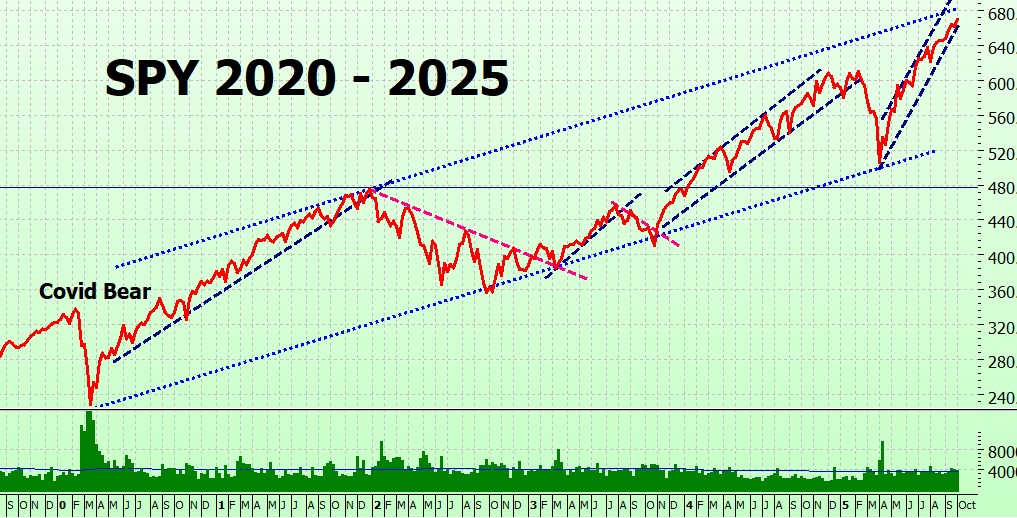
All quiet on the long term chart also.
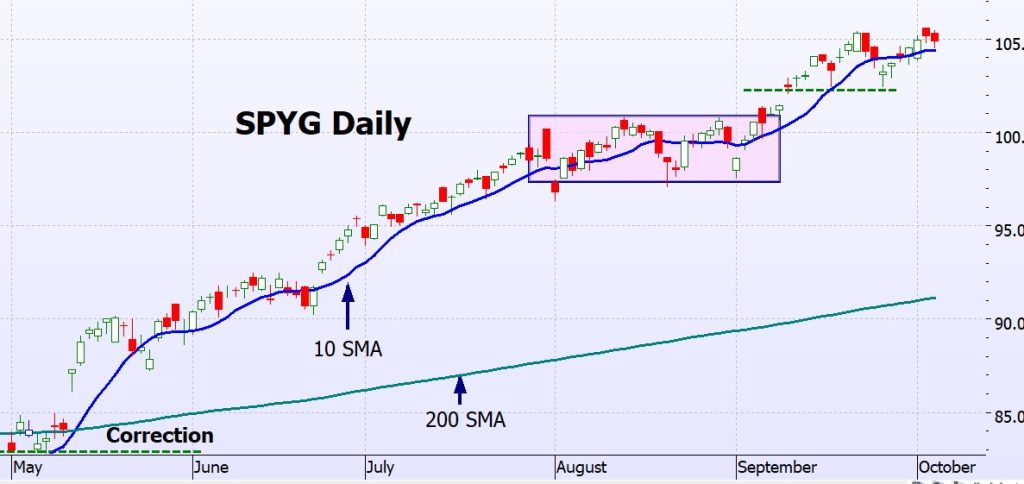
SPYG Charts
Similar to SPY, but seems to be having a bit of hesitation at the 105 mark. This week should see it rise above it, or else start forming another Darvas box.
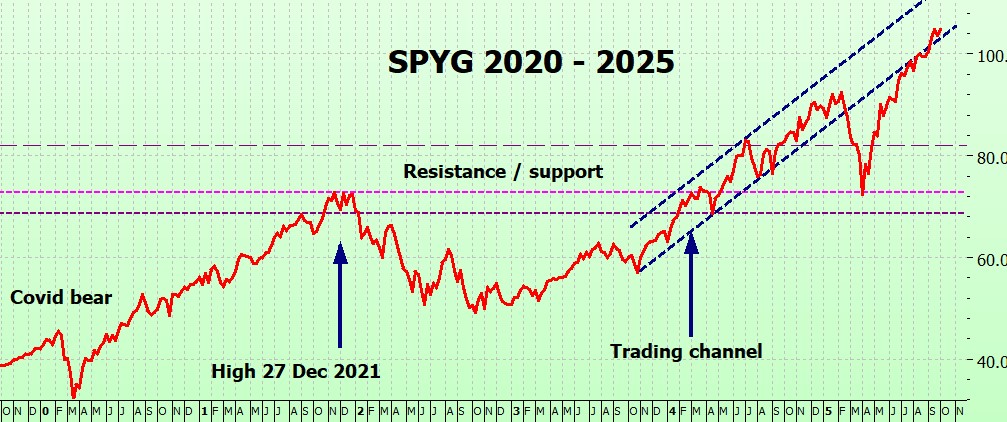
On the long term chart it is still crawling along the lower bound of the trading channel.
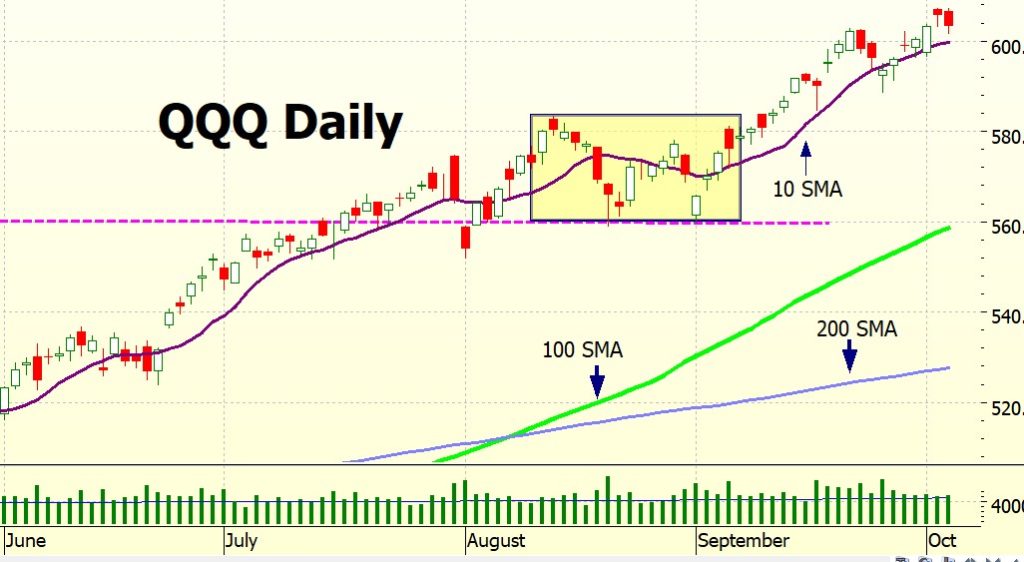
QQQ Charts
QQQ is making new highs, and has closed over 600 for 4 consecutive days.
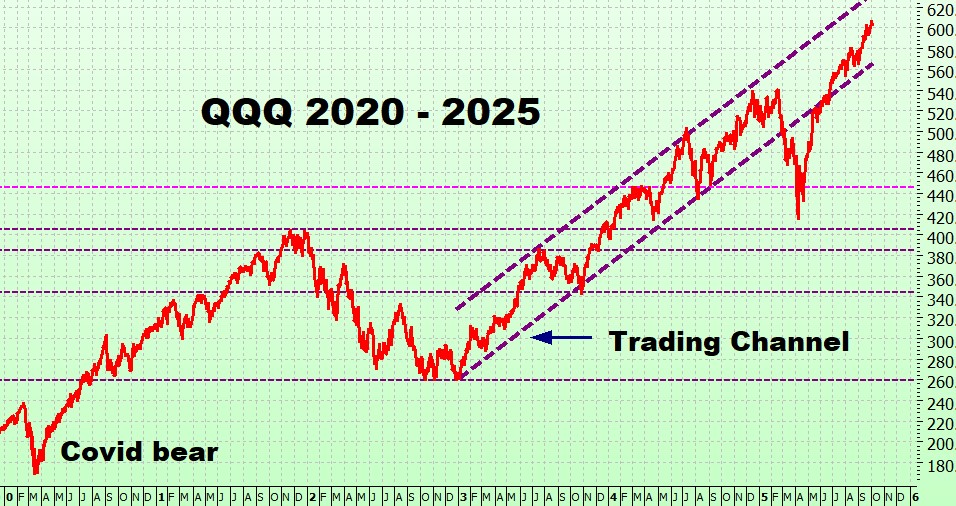
On the long term chart, it is right in the middle of its trading channel.
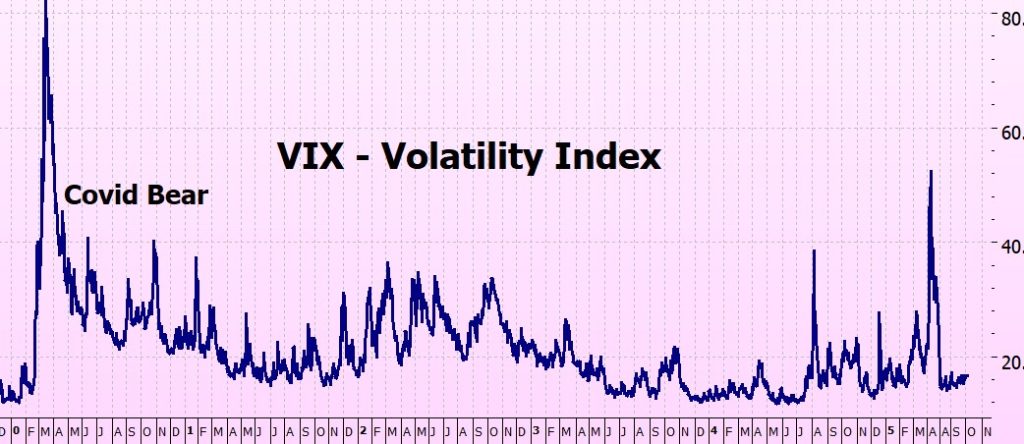
VIX Chart (Volatility)
The VIX continues in low-volatility territory.
ITMeter
The week ahead . .
Seems to be a quiet week. The Fed minutes are released, but there may be some delays to releases of jobs reports and inflation data because of the govt shutdown. PepsiCo, Delta and Levi Strauss will report. Talk of the rate cut coming in October not December (BofA). Quiet is fine by me.
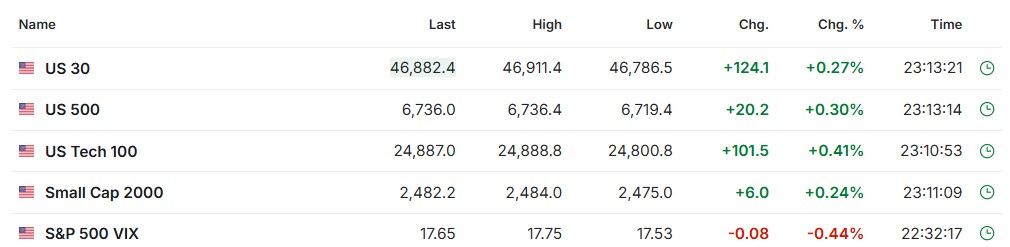
The Futures
Seem to be quite jolly at this stage, but 10 hours to market open.
No Audio this week
I decided that this week didn’t lend itself to an audio as it was just numbers and tables. Will be back next week.
Fingers crossed for a good week!
Heather
Trade the tide, not the waves
Q & A
23 Responses
Hi Heather! Thank you so much for the blog (and esp. answering comments — it is treasure of clarification on the topics)
I wanted to ask about the roll up rules if we use 60% ITM option on SPY (versus vanilla 50%) — what roll up rule for 60% ITM do you use, is it still 45% or 55% ?
Sincerely,
John
Hi John – good timing, just saw this come in as I was going to log off!
If you are using the 60% strike then I would roll up between 50 – 55%, not below. I am going through the backtesting right now for the next edition and I will have more figures when it is finished – but use 50 – 55 until then.
Hope this helps
h
Do you have any opinion or backtesting of the 10/200 SMA formula with other indices and individual stocks? What about using a third average like the 20 or 50 SMA as a stop loss if you are trading the SPY? Thanks for all you do! David
Heather has commented on this in the past (use the blog search), but I have wondered about a possible (and sensible) alternative myself.
Rather than use the 10-200 on individual stocks, I would be more tempted to test the ITM system on the SP500 Sector ETFs, like XLP, XLV, XLE, etc. I haven’t backtested, nor am I currently trading the ITM system this way (I am plain vanilla), but using the sector ETFs seems like a smarter way to do it if you want to exploit the strongest performers of the SPX.
HI Michael – yes a good idea to avoid individual stocks – but sector ETFs? I have never found thats sector trading works. Sectors are cyclical – as I am sure you know – and timing is an issue. You want to rotate from a sector that is past its peak into a rising sector – but how do you know except in hindsight?
I prefer the 2 biggest ones – SPY and QQQ – QQQ has most of the stronget performers but the overlap with SPY makes sure that you are exposed there also.
Maybe I am just lazy, but to me they are they most reliable indexes.
Hope this helps
h
I agree. I really think the SPY is the most consistent performer, at least for the ITM system. I have looked at branching out, even with QQQ, but I really can’t stand the whipsaws that the QQQ gives sometimes. Maybe I’m just too old and conservative…. 😉
Hi David
The 10/200 is the best combo on SPY – but I am backtesting others for QQQ and finding one that actually increases results significantly. I don’t want to jump the gun need some more exhaustive testing but it will be in the updated book, aiming to publish in time for the new year.
Re individual stocks – because they are unpredictable I wouldn’t recommend it – ITM depends on the stability of an index.
Using other SMAs – this is not really practical I’ve done a couple of blogs on that, here is the most recent: https://heathercullen.com/protecting-profits/
And here is one on stop losses: https://heathercullen.com/planning-to-lose/
Hope this helps!
h
Noticed that you haven’t posted, sending you well wishes hoping all is well.
I second that. Wishing Heather and all the best success……
Thank you Micheal – what lovely readers I have!
x
h
Thank you Kate – how kind of you! Yes, the only casualty was my temper – FastComet (hosting) have done some sort of upgrade that hasn’t worked well, and I couldn’t login to my account. They gave me a backdoor, but when I got in my account was empty – no websites, nothing!! Neturally I panicked, and then just about wore my fingers out on ‘live chat’ and support tickets for several hours. ANother backdoor got me into the blog, but it was late – and the whole issue is still not resolved, so tomorrow back on the warpath!
But thank you for noticing – I was quite touched!
What lovely readers I have!
x
h
I am sorry for all the tech trouble, but so happy that you are fine.
And wow what a swing in the futures today ( Oct 12)
Hi Kate – thank you. I get so frustrated with tech issues – I used to have a whole department to sort them out now its just me! That took a lot of getting used to.
Yes, futures – have just taken the snapshot for the blog – I dumped what I was going to write about and did it on the current situation instead.
Hope it is helpful! Just going to put it up now, hope the tech behaves itself!
‘x’
h
Dear Heather,
Even though bullish markets last 6 years and bearish markets last 1 year, many investors and traders suffer significant losses during bearish markets due to greed and using leveraged money and impatience.
Hey George Henry – oh yes, bear markets can totally devastate people, and leverage is the quickest way to do it! I’ve just been rewriting the chapter on leverage – and decided to call it: Leverage: Magic & Mahem – I think that says it all!
h
The numbers have some problems.
For example: “The second bull from 1987 to 2000, total gain 582%, lasted 4492 days. Gain per day is 0.13%”
But you cannot simply divide 5.82 by 4492 to calculate the daily gain. Because daily gains compound. daily gain 0.13% compounding 4492 days will become (1 + 0.0013) ** 4492 – 1 = 34,134.11% total gain! It’s significantly larger than 582%.
The correct daily gain should be (1 + 5.82) ** (1/4492) – 1 = 0.043%.
And it turns out that the latest bull market has larger daily gain: (1 + 0.88) ** (1/1090) – 1 = 0.058%
You’re absolutely right — the “gain per day” numbers in my table came from simple division, not compounding. I should have explained that more clearly.
But I was really just aiming for a broad comparison between bull markets, not an interest-rate-style precision measure. The compounding formula —
(
1
+
gain
)
1
/
days
−
1
(1+gain)
1/days
−1 — assumes a smooth, consistent rate of increase, like earning interest. Markets don’t move like that. They jump, stall, fall, and surge again. So while the compounding approach is mathematically elegant, it doesn’t really reflect how returns accumulate in a volatile market.
In other words, the figures in my table are meant as relative indicators of market strength, not as literal day-by-day “interest rates.”
Thanks for pointing it out — I always appreciate readers who dig into both the math and the markets.
Dear Heather,
Your commentary, particularly the last few weeks, has really been outstanding. Thanks for taking the time to educate us. I’m due to roll all my calls on SPY, QQQ and SPYG in December. On average, I’m up about 34% since I entered the market this Spring. Nothing compares to this trading method for safely making money. I only wish you had published your materials about ten years earlier!
With all the best wishes,
Bill
Hi Bill – thank you! I really appreciate it!
Glad your account is looking healthy – and yes, I wish I had discovered it 10 years before I did too!
X
H
I have found that the most difficult part of trading is…. doing nothing. I have learned to never, never sell my longs in a rising bull market.
Hey Michael – you are right! I think someone said ‘don’t just do something, sit there!’ – absolutely correct I think.
Studies show that people tend to sell their winners and hang on to their losers – the opposite of what you need to do to win in the market!
But its not easy – I am planning to do the next blog on hanging in there in bull markets, I hope you’ll find it interesting.
H
In your personal account do you ever implement the Wheel Strategy, I.e. Selling Puts on Stocks you wouldn’t mind owning and then, if Assigned, Selling Covered Calls?
Hi Phillip – I played with the Wheel on SPY and QQQ – writing covered calls against stock, then selling cash-covered puts if exercised. I found it a lot of work for very little return, the premiums are so low. I would have made around 4 times the money just holding the actual stock. However, it keeps getting suggested so I check it out every so often.
I tested it against a couple of stocks with high premiums – two of the Magnificent seven from memory, but that was pretty dismal returns as well.
Re ‘stocks I wouldn’t mind owning’ – there are no stocks I ‘wouldn’t mind owning’. I don’t do stocks – used to, of course, but realised that stock picking only works in hindsight – as is borne out by many studies.
So quick answer – no, I don’t find it profitable. I can see that it may work on a sideways, range-bound market but that’s not what we have got.
Hope this helps.