


Why bother with charts?
It was a question that set my back on my heels the other day – along the lines of ‘if we have clear ITM signals for buying and selling why bother with candlesticks, charts, and all that?’
A fair question. I sat down with a cup of coffee to think about it. Why, indeed? I came up with two reasons:
Autopilot isn’t enough

Think of it like flying a plane. You have two highly trained pilots – and an autopilot. The autopilot does most of the flying, but would you trust an airline that relies solely on autopilots?
I wouldn’t.
I’m quite happy for the plane to be on autopilot – as long as there’s a real pilot watching, one who knows what’s happening and what the system should be doing. In other words, riding shotgun on the autopilot – and that’s you. You need an awareness of what is going on.
I wouldn’t be brave enough– or foolhardy enough – to trade without knowing what was happening and what’s likely to happen next. That’s why I am a committed chart reader: checking what’s happening now, comparing it with times in the past and noting similarities.
History doesn’t repeat itself, but it often rhymes.
Mark Twain

Mass Psychology

The stock market is made up of millions of people, all making emotional decisions – and then justifying them afterwards with logic.
Fortunately, we have an objective record of all these emotions – stock charts.
An index chart is the purest record of all because, while individual stocks can be jolted by unpredictable events, an index like SPX reflects the collective mood of the market itself.
Sticking to the rules
We all know we should exercise more, drink more water, eat more kale, floss every day – but do we? Probably not. People rarely do all the things they know are good for them. I certainly don’t (kale? Yeccchhh).
And so it is with trading. Traders know that they should let winners run but studies show that they tend to ‘take profits’ too early. Traders know that they should cut their losses – but often to hang on hoping prices will bounce back. Traders know they shouldn’t panic – but every dip brings a surge in volume as traders fearfully scramble to exit.

We’ve looked at trading psychology often enough in these blogs to know that traders don’t always act in their own best interests.
Just as in life, you don’t always do what is good for you. We all know what we should do, but do we?
Even when you know you’re using a proven, winning system, the temptation to second-guess the market never disappears. Sticking to the rules in trading is just as hard as sticking to the rules in life.
Why do I write the Blog?
I’ve been asked ‘what’s the catch?’ and ‘you must have an angle!’. Well, if you have been reading the Blog you’ll know that there is no hidden agenda. I am not luring anyone into a money trap.
Part of the reason is that I want to help people avoid the sharks and charlatans – the so-called ‘advisers’ and fund managers who can’t make money for themselves but seem very good at helping their clients lose it.
The other part is selfish: writing the blog makes me look at what is actually there, not what I think is there. The surest way to understanding something is to explain it to someone else – so every week I get my own reality check!

Why is the blog free?
Because I like my independence. I don’t want to feel obligated, filtered, or tied down. I write what I believe to be true. If people like it, great. If they don’t – that’s fine too. They didn’t pay for it, and they don’t have to read it.
To the markets . .
A perfect ‘nothing’ week. The market just can’t decide what to do. Let’s check the charts.
SPY Charts
All last week (13–17 October 2025), SPY traded in inside days — each day’s range sat within the major candle from the previous Friday (10 October). Volume stayed above average throughout, showing that traders haven’t been scared off; both bulls and bears remain active but evenly matched. It’s a classic standoff — plenty of participation, but no conviction.
Momentum is coiling – the longer the compression, the sharper the release. The underlying trend is still up, so the odds favour a breakout to the upside; but if it breaks to the downside, the volume suggests the move could have teeth. Whichever blinks first, bulls or bears, it’s going to be significant.
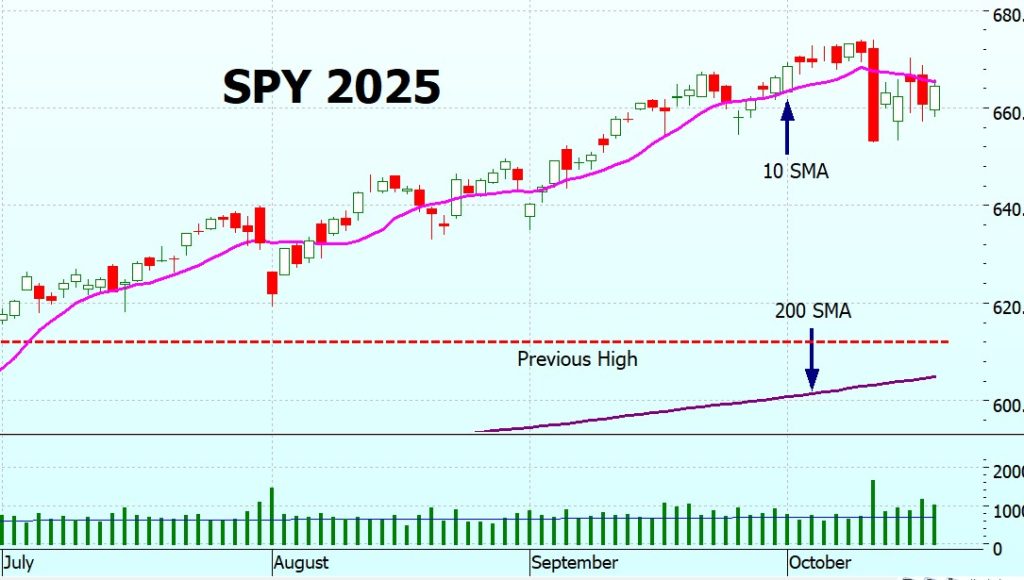
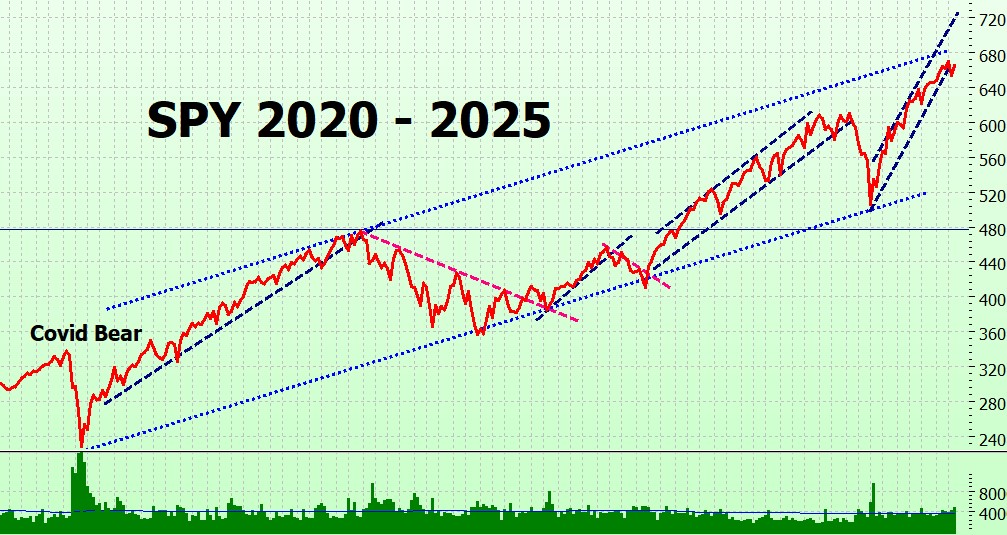
And the longer term chart has no surprises. Back to the lower bound of the trading range. Actually, that chart looks a bit busy. Maybe I should take some of the lines off. Thoughts?
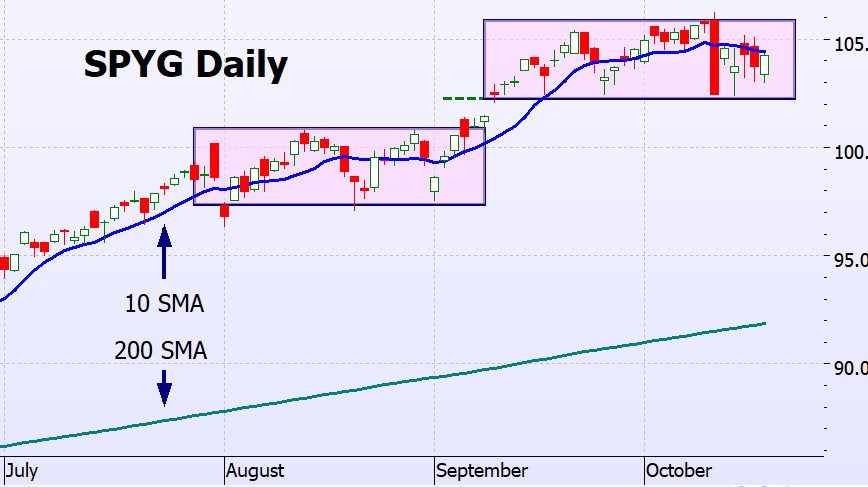
SPYG Charts
SPYG showed the same pattern as SPY last week, so the same analysis applies. In addition, it looks to be forming another Darvas box – trading in the same range it’s been stuck in since early September. It’s getting a bit boring, but the longer it builds the box, the more decisive the breakout usually is.
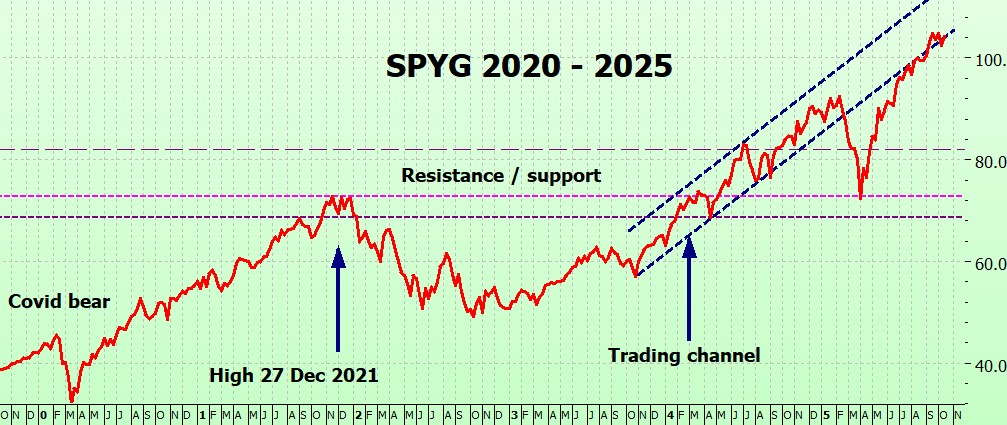
On the long term chart SPYG is still on the lower bound of the trading range.
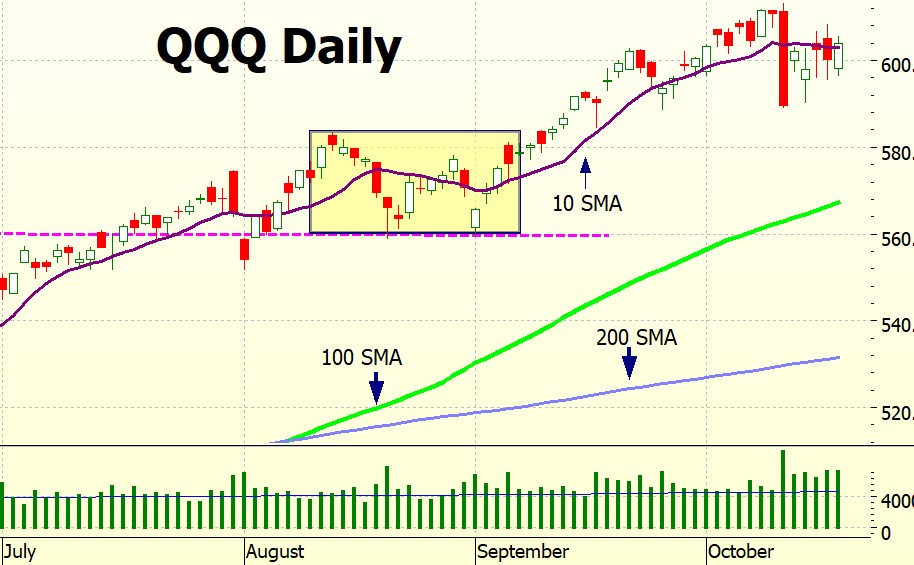
QQQ Charts
Again, QQQ followed the same pattern as SPY, so the same analysis applies here too. The one difference is volume — it’s been very high, showing plenty of activity but not much direction. Watch for the breakout when it comes; it should be a strong one.

On the long term chart – no surprises. Still in the middle of the trading range.
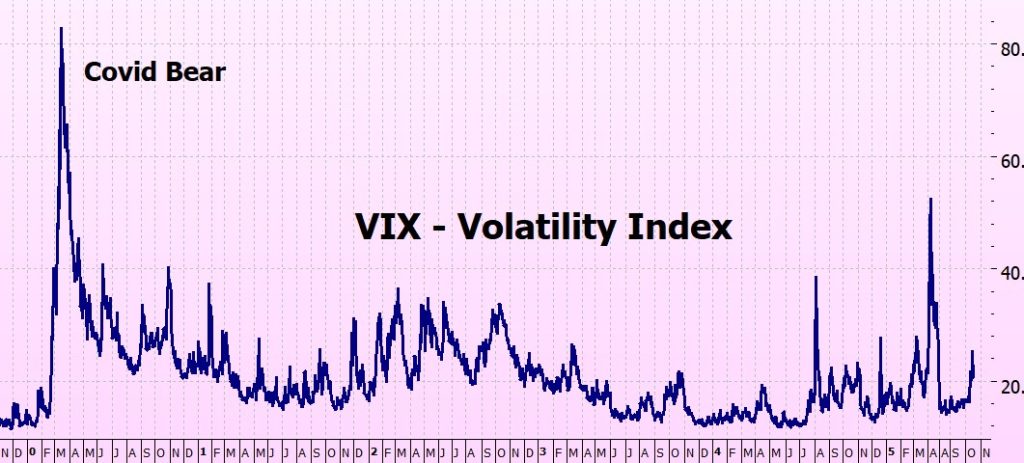
The VIX Chart (Volatility)
The VIX looks as though it has peaked and is drifting back toward low-volatility territory. Famous last words — I really shouldn’t tempt fate again!
ITMeter

The week ahead . . .
Nvidia (NVDA) was upgraded by HSBC last week, citing strong demand for its AI chips and forecasts that data-centre revenue could reach $400 billion. This week’s major earnings include Netflix (NFLX), Tesla (TSLA), and Intel (INTC).
U.S. economic data: the Producer Price Index (PPI) and retail-sales figures are due Thursday, October 23, followed by the Consumer Price Index (CPI) on Friday, October 24. The next Federal Reserve meeting is scheduled for October 28–29, with markets expecting no major surprises ahead of it and with the market expecting a quarter-point cut in the federal funds rate.
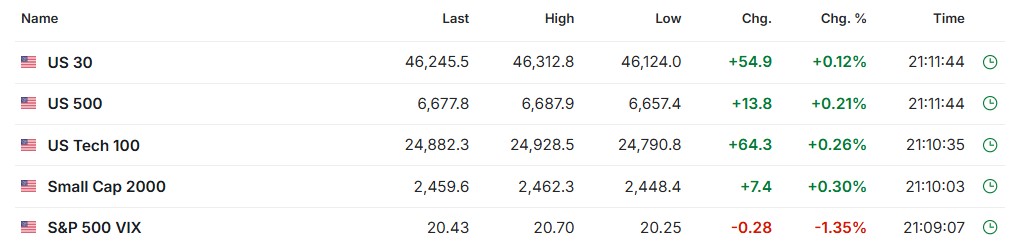
The futures
The futures seem quite happy – ignoring the govt shutdown and the trade tensions. But it is still 11 hours to market open.
Fingers crossed for a good week!
Heather
Trade the tide, not the waves
Q & A
I think I’ve answered all the questions from the last couple of weeks . If I have missed any please put them in again here. I’ve been concentrating on writing / backtesting and let a lot of other things slide! Sorry.


18 Responses
The BIG Tech earnings at the end of October should mark the initial launch (one way or another). It seems that the market goes into a “stall” mode during the two weeks prior. This month we have the extra fuel of the FOMC meeting. Although there are more (and significant) earnings in November, I believe that the theme for the following weeks will be indicated by the end of October. Keeping our fingers crossed!!
HI Vern – interesting – end of October would be good, I am never one for delayed gratificatin!
h
Heather,
I am a huge fan of your insights, I look forward to reading your blogs every Monday. I look forward to your next book. Thank you for all of your insights over the past few years. My trading account has never been stronger, and I owe it all to your ITM strategy.
David – how lovely! Thank you so much for taking the time to write this!
x
h
Heather,
A few weeks ago I asked about your thoughts on protecting profits, and you devoted the next week’s blog on that subject. I have continued to noodle on that subject. During this current Bull Run, since our Golden Cross, I have followed the ITM strategy and even boosted leverage at certain points to where on a day to day basis, if QQQ and SPY was up 1% for the day, my daily return might be 3%. At other times I would adjust leverage down a bit, to where my daily return was 2x what QQQ and SPY did for the day. That is one way I have learned to ease into and out of higher risk situations, rather than getting all out and all in, which is how I interpreted your explanation of using a different set of SMAs. My actions are to take Risk as far as I am willing to stomach. One problem with my method is it requires watching my accounts every day, and that can take some time. I am playing around with AI (ChatGPT) to help me formulate a mechanical set of steps, that look at other parameters to tell me when to ease in and out, not totally exiting all contracts, but rather adjusting a portion of my contracts to a lower leverage point. I like to use the analogy of a high performance sports car, and you don’t always want to have the pedal to the floor, sometimes you need to ease off the throttle a bit. I used it successfully a couple weeks ago, going into the week leading into US Gov’t Shutdown. Once I saw the market wasn’t reacting negatively, I pushed the throttle back down. The China annoucement on the rare earth restrictions a couple weeks ago, came out of no where, and the 3% drop in QQQ and SPY on that day would have yielded me a greater than 9% drop in my account, I did take some corrective actions mid-day and was able to curb my loses to around a 7% drop. My concern was not knowing if we were going to see more than one day of market selling off, and keeping the throttle to the floor could have yielded multiple days of >9% loses. Luckily the market did recover, my protective puts, and rolling back a couple contracts, allowed me to get back in the market quickly.
A couple things AI suggested was comparing the distance between 10 SMA and 200 SMA and the slope of the 10 SMA, also looking at RSI >70, and a couple other ideas.
I would like to hear your thoughts on what I am doing and see if you have some ideas on what to look at as triggers for when to ease off the throttle and ease back into the throttle as conditions in the market evolve or maybe even brake harder if market conditions continue to degrade. I don’t want to confuse your readers, so I will defer to your discretion on posting this reply.
Hi David – it all sounds like a good idea – but a lot of work!
I totally understand reducing your leverage if you are twitchy – I’ve just found that in practice – for me – it doesn’t really work. I’m not saying it won’t work for you, just it doesn’t for me. Plus I am in Australia and the US market opens at 10:30PM so I always try to any trading in the firs 90 minutes (I need my sleep!)
Re RSI and other indicators – yes, they work sometimes – you just don’t know when they are going to work and when they aren’t.
But thats not to say that there isn’t a combonation that hasn’t been discovered yot – if you find it please let us know!
x
h
Hi Heather, I listened to your recent podcast with Louise Bedford and really enjoyed it, so then had a look at your website which I also really liked, and then bought your Bull Market Strategy book which I am also enjoying! A clean sweep so far. 🙂 Having reached page 237 of the book, I have a question for you. Rather than use deep ITM options for your strategy, would it not achieve the same or similar results if you used vehicles like this one, “WisdomTree NASDAQ 100 3x Daily Leveraged (LSE:QQQ3)”? With this approach, you wouldn’t need to keep rolling your position and you could get in and out of the position using the same rules as you do for the option trade. I suspect that I am missing something obvious, but I would be interested in your views? Thank you and keep up the great work. Neil
Hi Neil,
you’ve probably read it by now – it is in Ch 12 Leverage & protection starting on page 247 (hardback).
Leveraged ETFs are not a good idea – they are made for day trading only, not as longer term vehicles (because of the daily reset – see the book or this blog https://heathercullen.com/stock-market-or-casino/ for more information. Even the SEC warns against them.
If you still have questions after you have read the relevant bit in the book then please get back to me.
Hope this helps
h
I do not think your charts are too busy. I am used to them as they are and would feel I were missing something if you made them less busy. So my strong vote is: Leave ’em as is.
Hi Jay – great, thank you.
Always good to get feedback.
x
h
For all intents and purposes…my reality check is “ I’m a professional chair warmer and food taster “… great blog! As the co pilot to the 172 Cessna – soon as pilot goes limp – the copilot (me) radios “ emergency “ to anyone listening… the chartist ( won’t be able to pick the top or the bottom – but hogs always get slaughtered. fishing tom and flying the next but always come back to “ itm “
r
Hey Randy – luckily I have never had an emergency situation – and its some years since I have flown.
But it was great fun, loved being in the air.
x
h
I have read both ITM books, bear and bull, and like your strategy. I only trade stock and index options, thus I understand and feel comfortable with your clever approach.
My question is whether you have ever considered using the XSP, which is similar to SPY in that it is 1/10 the value of the SPX and tracks the SPX. I appreciate that you are not a tax expert, but for American investors, the XSP has clear advantages for taxable gains related to Rule 1256 of the U.S. Internal Revenue Service. I am considering the 20 March 2026 $400 strike for either the XPS or the SPY. The after-hours option chain is quite similar for both indices, with the SPY being less than $2 lower for the midpoint bid/ask price. Open interest is lower for the XSP, but as you point out, this is not a real concern for these indices. Thank you.
Some one asked a similar question several months ago. And I answered that question: XSP bid/ask spread is too large. I didn’t check the option chain now, but let’s assume that the bid/ask spread is 2% of index price (for SPY it’s normally 0.5%). Then every time you roll your position, you lose 2% of notional. It would be 4% of your capital if you are on a 2x leverage. It’s not cool to lose 4% every time you roll.
Nowaday I would suggest people to use futures instead. https://finance.yahoo.com/quote/MES=F/. It has extremly good liquidity (much better than SPY options). And its carry cost is lower than option time decay. Futures is simply more efficient way to apply leverage than options. And it also uses tax Rule 1256.
Disclaimer: I am not the author of the ITM books. I am just a reader of Heather’s blog articles, just like you. What I posted is just for your information, you are responsible for whatever decision you make.
HI Richard
yes, you are right – I am not a tax expert! I do understand that XSP qualifies for 60/40 tx treatment – but that’s about all I know.
You see, I am based in Australia, and these have international restrictions so on Schwab I can’t even see the options chain!
They are European options, and my experience with them is that they behave quite differently to American options – price-wise I mean. But that’s just my observation, I have never really studied it.
Just check the spread (if it is more than, say, 4% I would reconsider) and dip your toe in the water gently – and do let us know how you get on!
h
Hi Heather!
Thanks so much for the blog! (Even if I sometimes go months without leaving a comment, I still read every post—appreciate it a ton!)
Given the uncertainty in our current situation, would it make sense to deleverage from options to just holding SPY ETF at 1.0x leverage? That way, a big dip wouldn’t be as scary, and if the market rises, we could switch back to 60% ITM SPY options.
I know this is essentially trying to time the market, but with potential U.S.-China trade decoupling, who knows what might happen!
Fingers crossed for a good week! – indeed!
John
Hey John, this is NOT Heather, LOL, but have you considered using a higher strike price to deleverage your trade? This will cap your maximum downside risk to the price of the option, free up some capital from the lower priced option, but still allow you participate in a possible upside move. Just thinking out loud here.
HI JOhn
thank you!
And re moving to shares rather than options – it depends on your account and your tolerance!
I have my accounts now divided into ‘investments’ (unleveraged – SPY & QQQ) and trading (leveraged – options – SPY – QQQ) as I am aware that I need some base level stability in my old age! As my options go up I squirrel away some of it into the investment account.
It is something I’ve only been doing for a year or so – my account was getting to the size where it made sense.
I probably wouldn’t do it if I were younger, with more time to recover if there was a black swan.
So if that makes you sleep better at night – then go for it!
Hope this helps
h