


Panic First, Think Later
Another week where panic ran well ahead of thinking. Some international headlines about tariffs and Greenland was enough to send everyone fleeing for the exits. So, on Tuesday the market slumped, the biggest one day drop in months.
Armageddon?
You would think so from the market reaction. But let’s look at what actually happened.
I was on holiday, so I wasn’t noting things down as they happened, just watching bemusedly from the sideline – as in, I was on the sidelines of the panic, not the sidelines of the market.
To be clear: I made no market moves this week.
Headlines Ruled

What had actually happened? Nothing really. We’ve ended the week roughly where we started. It’s important to separate what happened from what was said. Commentary is plentiful; consequence is scarce. Most of the week’s market chatter fell firmly into the former category. Opinion, speculation, and interpretation moved faster than facts – and prices followed, briefly.
Davos: Sound and Fury . .
Davos is a reliable source of market nerves. Big themes, sweeping statements, and earnest warnings create the impression that something fundamental has shifted. In reality, very little ever does. Markets respond to tone long before substance, even when substance never arrives.

. . Signifying Nothing
Who can forget the dire warnings from Davos in the past? The New Ice Age Starting , Global Famine by 2000, Entire Polar Ice Cap Gone by 2014!
Davos evolved from a dry management seminar into a megaphone for environmental alarmism. But in 2026, the vibe has shifted.
The forum has pivoted back to raw economics and market mechanics. The talk is the only thing that changes, the same dire warnings are still issued.

The Art of the Deal
Of course, it was President Trump who put the cat among the pigeons. What I can’t understand is how people are continually surprised. Many years ago, before anyone even thought of Trump becoming president, I read The Art of the Deal where Trump lays out his negotiating tactics, a hybrid of hard-bargaining and game theory.
The Art of the Deal Tactics
Leveraging Unpredictability: By maintaining an “everything is on the table” stance, he prevents opponents from accurately calculating his “walk-away” point, which often leads them to offer larger concessions to avoid a worst-case scenario.
High-Stakes Credibility: The strategy depends on making threats – like broad tariffs or exiting long-standing treaties – that the market and global leaders perceive as credible. This forces immediate movement that traditional, private diplomacy rarely achieves.
Public Theater as Leverage: He often moves negotiations from private rooms to public platforms. This serves to build pressure on foreign leaders via their own domestic economies while signaling to his base that he is prioritizing a specific national interest.
Reciprocal Concessions: Once a “framework” is reached, he often pivots to a more collaborative tone, framing the result as a “win-win” to help the other party save face, even if the final deal is closer to his original anchor than the previous status quo.
The Beeping Obvious
So why is everyone surprised when he follows his own blueprint? Because journalism has pivoted to a “click-first” model to survive, replacing expensive, slow-form analysis with high-velocity sensationalism. Because fear is the most efficient driver of engagement, newsrooms often weaponize the “Curiosity Gap” – using alarming headlines to trigger immediate clicks from an audience already saturated with information. The 24-hour cycle is filled by “panic merchants”, hence the volatility.
Analysis seeks to provide clarity, while panic seeks only to capture attention.
Trading the Headline Cycle
This week wasn’t a “reasoned approach” to international events; it was a demonstration of the ‘Art of the Deal’ negotiation style translated into market data. The pattern is now a matter of historical record: a maximalist threat creates a volatility spike, then a negotiated “framework” that triggers a relief rally.

The S&P 500 closed the week at 6,915.16, effectively erasing the ‘Greenland Gap’ and reclaiming its position after Tuesday’s sharp decline. The charts show that capital flows are currently dictated by the negotiation cycle: as soon as the immediate threat of a trade war was priced out, the mechanical bid returned to the market.”
To the markets . . .
Well, we have covered most of what happened, so let’s get onto the charts:
SPY Charts
After the panic drop, back to normal.
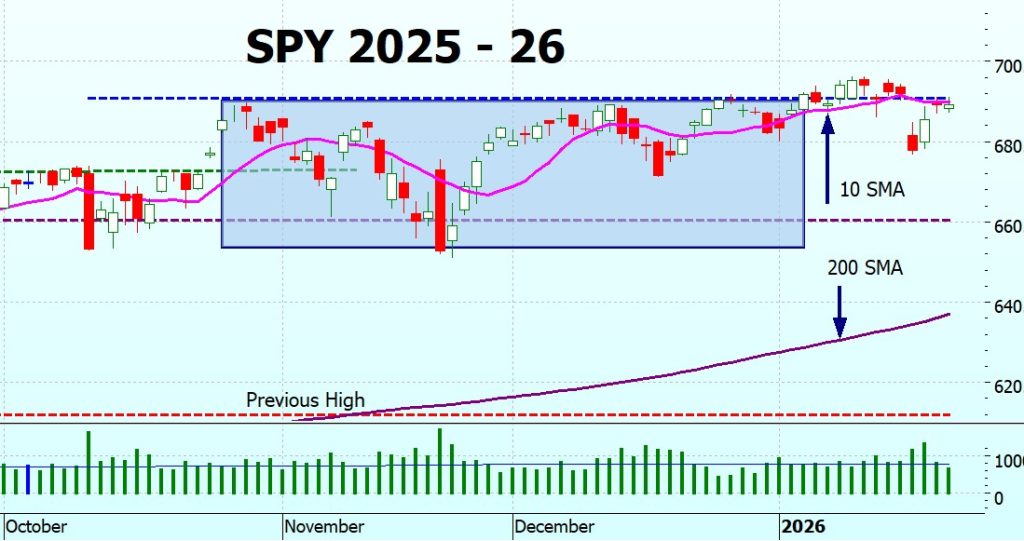
Same on the weekly chart:
![{"type":"elementor","siteurl":"https://heathercullen.com/wp-json/","elements":[{"id":"2ce5b08","elType":"widget","isInner":false,"isLocked":false,"settings":{"style":"solid","separator_type":"pattern","pattern_spacing_flag":"no-spacing","pattern_round_flag":"bg-round","width":{"unit":"%","size":100,"sizes":[]},"width_tablet":{"unit":"%","size":"","sizes":[]},"width_mobile":{"unit":"%","size":"","sizes":[]},"align":"","align_tablet":"","align_mobile":"","look":"line","text":"Divider","html_tag":"span","icon":{"value":"fas fa-star","library":"fa-solid"},"color":"#DFDFDF","weight":{"unit":"px","size":4.9,"sizes":[]},"pattern_height":{"unit":"px","size":20,"sizes":[]},"pattern_size":{"unit":"px","size":20,"sizes":[]},"gap":{"unit":"px","size":4,"sizes":[]},"gap_tablet":{"unit":"px","size":"","sizes":[]},"gap_mobile":{"unit":"px","size":"","sizes":[]},"text_color":"","typography_typography":"","typography_font_family":"","typography_font_size":{"unit":"px","size":"","sizes":[]},"typography_font_size_tablet":{"unit":"px","size":"","sizes":[]},"typography_font_size_mobile":{"unit":"px","size":"","sizes":[]},"typography_font_weight":"","typography_text_transform":"","typography_font_style":"","typography_text_decoration":"","typography_line_height":{"unit":"px","size":"","sizes":[]},"typography_line_height_tablet":{"unit":"em","size":"","sizes":[]},"typography_line_height_mobile":{"unit":"em","size":"","sizes":[]},"typography_letter_spacing":{"unit":"px","size":"","sizes":[]},"typography_letter_spacing_tablet":{"unit":"px","size":"","sizes":[]},"typography_letter_spacing_mobile":{"unit":"px","size":"","sizes":[]},"typography_word_spacing":{"unit":"px","size":"","sizes":[]},"typography_word_spacing_tablet":{"unit":"em","size":"","sizes":[]},"typography_word_spacing_mobile":{"unit":"em","size":"","sizes":[]},"text_stroke_text_stroke_type":"","text_stroke_text_stroke":{"unit":"px","size":"","sizes":[]},"text_stroke_text_stroke_tablet":{"unit":"px","size":"","sizes":[]},"text_stroke_text_stroke_mobile":{"unit":"px","size":"","sizes":[]},"text_stroke_stroke_color":"#000","text_align":"center","text_spacing":{"unit":"px","size":"","sizes":[]},"text_spacing_tablet":{"unit":"px","size":"","sizes":[]},"text_spacing_mobile":{"unit":"px","size":"","sizes":[]},"icon_view":"default","icon_size":{"unit":"px","size":"","sizes":[]},"icon_size_tablet":{"unit":"px","size":"","sizes":[]},"icon_size_mobile":{"unit":"px","size":"","sizes":[]},"icon_padding":{"unit":"px","size":"","sizes":[]},"primary_color":"","secondary_color":"","icon_align":"center","icon_spacing":{"unit":"px","size":"","sizes":[]},"icon_spacing_tablet":{"unit":"px","size":"","sizes":[]},"icon_spacing_mobile":{"unit":"px","size":"","sizes":[]},"rotate":{"unit":"deg","size":"","sizes":[]},"rotate_tablet":{"unit":"deg","size":"","sizes":[]},"rotate_mobile":{"unit":"deg","size":"","sizes":[]},"icon_border_width":{"unit":"px","size":"","sizes":[]},"border_radius":{"unit":"px","size":"","sizes":[]},"_title":"","_margin":{"unit":"px","top":"","right":"","bottom":"","left":"","isLinked":true},"_margin_tablet":{"unit":"px","top":"","right":"","bottom":"","left":"","isLinked":true},"_margin_mobile":{"unit":"px","top":"","right":"","bottom":"","left":"","isLinked":true},"_padding":{"unit":"px","top":"","right":"","bottom":"","left":"","isLinked":true},"_padding_tablet":{"unit":"px","top":"","right":"","bottom":"","left":"","isLinked":true},"_padding_mobile":{"unit":"px","top":"","right":"","bottom":"","left":"","isLinked":true},"_element_width":"","_element_width_tablet":"","_element_width_mobile":"","_element_custom_width":{"unit":"%","size":"","sizes":[]},"_element_custom_width_tablet":{"unit":"px","size":"","sizes":[]},"_element_custom_width_mobile":{"unit":"px","size":"","sizes":[]},"_grid_column":"","_grid_column_tablet":"","_grid_column_mobile":"","_grid_column_custom":"","_grid_column_custom_tablet":"","_grid_column_custom_mobile":"","_grid_row":"","_grid_row_tablet":"","_grid_row_mobile":"","_grid_row_custom":"","_grid_row_custom_tablet":"","_grid_row_custom_mobile":"","_element_vertical_align":"","_element_vertical_align_tablet":"","_element_vertical_align_mobile":"","_position":"","_offset_orientation_h":"start","_offset_x":{"unit":"px","size":0,"sizes":[]},"_offset_x_tablet":{"unit":"px","size":"","sizes":[]},"_offset_x_mobile":{"unit":"px","size":"","sizes":[]},"_offset_x_end":{"unit":"px","size":0,"sizes":[]},"_offset_x_end_tablet":{"unit":"px","size":"","sizes":[]},"_offset_x_end_mobile":{"unit":"px","size":"","sizes":[]},"_offset_orientation_v":"start","_offset_y":{"unit":"px","size":0,"sizes":[]},"_offset_y_tablet":{"unit":"px","size":"","sizes":[]},"_offset_y_mobile":{"unit":"px","size":"","sizes":[]},"_offset_y_end":{"unit":"px","size":0,"sizes":[]},"_offset_y_end_tablet":{"unit":"px","size":"","sizes":[]},"_offset_y_end_mobile":{"unit":"px","size":"","sizes":[]},"_z_index":"","_z_index_tablet":"","_z_index_mobile":"","_element_id":"","_css_classes":"","e_display_conditions":"","motion_fx_motion_fx_scrolling":"","motion_fx_translateY_effect":"","motion_fx_translateY_direction":"","motion_fx_translateY_speed":{"unit":"px","size":4,"sizes":[]},"motion_fx_translateY_affectedRange":{"unit":"%","size":"","sizes":{"start":0,"end":100}},"motion_fx_translateX_effect":"","motion_fx_translateX_direction":"","motion_fx_translateX_speed":{"unit":"px","size":4,"sizes":[]},"motion_fx_translateX_affectedRange":{"unit":"%","size":"","sizes":{"start":0,"end":100}},"motion_fx_opacity_effect":"","motion_fx_opacity_direction":"out-in","motion_fx_opacity_level":{"unit":"px","size":10,"sizes":[]},"motion_fx_opacity_range":{"unit":"%","size":"","sizes":{"start":20,"end":80}},"motion_fx_blur_effect":"","motion_fx_blur_direction":"out-in","motion_fx_blur_level":{"unit":"px","size":7,"sizes":[]},"motion_fx_blur_range":{"unit":"%","size":"","sizes":{"start":20,"end":80}},"motion_fx_rotateZ_effect":"","motion_fx_rotateZ_direction":"","motion_fx_rotateZ_speed":{"unit":"px","size":1,"sizes":[]},"motion_fx_rotateZ_affectedRange":{"unit":"%","size":"","sizes":{"start":0,"end":100}},"motion_fx_scale_effect":"","motion_fx_scale_direction":"out-in","motion_fx_scale_speed":{"unit":"px","size":4,"sizes":[]},"motion_fx_scale_range":{"unit":"%","size":"","sizes":{"start":20,"end":80}},"motion_fx_transform_origin_x":"center","motion_fx_transform_origin_y":"center","motion_fx_devices":["desktop","tablet","mobile"],"motion_fx_range":"","motion_fx_motion_fx_mouse":"","motion_fx_mouseTrack_effect":"","motion_fx_mouseTrack_direction":"","motion_fx_mouseTrack_speed":{"unit":"px","size":1,"sizes":[]},"motion_fx_tilt_effect":"","motion_fx_tilt_direction":"","motion_fx_tilt_speed":{"unit":"px","size":4,"sizes":[]},"handle_motion_fx_asset_loading":"","sticky":"","sticky_on":["desktop","tablet","mobile"],"sticky_offset":0,"sticky_offset_tablet":"","sticky_offset_mobile":"","sticky_effects_offset":0,"sticky_effects_offset_tablet":"","sticky_effects_offset_mobile":"","sticky_anchor_link_offset":0,"sticky_anchor_link_offset_tablet":"","sticky_anchor_link_offset_mobile":"","sticky_parent":"","_animation":"","_animation_tablet":"","_animation_mobile":"","animation_duration":"","_animation_delay":"","_transform_rotate_popover":"","_transform_rotateZ_effect":{"unit":"px","size":"","sizes":[]},"_transform_rotateZ_effect_tablet":{"unit":"deg","size":"","sizes":[]},"_transform_rotateZ_effect_mobile":{"unit":"deg","size":"","sizes":[]},"_transform_rotate_3d":"","_transform_rotateX_effect":{"unit":"px","size":"","sizes":[]},"_transform_rotateX_effect_tablet":{"unit":"deg","size":"","sizes":[]},"_transform_rotateX_effect_mobile":{"unit":"deg","size":"","sizes":[]},"_transform_rotateY_effect":{"unit":"px","size":"","sizes":[]},"_transform_rotateY_effect_tablet":{"unit":"deg","size":"","sizes":[]},"_transform_rotateY_effect_mobile":{"unit":"deg","size":"","sizes":[]},"_transform_perspective_effect":{"unit":"px","size":"","sizes":[]},"_transform_perspective_effect_tablet":{"unit":"px","size":"","sizes":[]},"_transform_perspective_effect_mobile":{"unit":"px","size":"","sizes":[]},"_transform_translate_popover":"","_transform_translateX_effect":{"unit":"px","size":"","sizes":[]},"_transform_translateX_effect_tablet":{"unit":"px","size":"","sizes":[]},"_transform_translateX_effect_mobile":{"unit":"px","size":"","sizes":[]},"_transform_translateY_effect":{"unit":"px","size":"","sizes":[]},"_transform_translateY_effect_tablet":{"unit":"px","size":"","sizes":[]},"_transform_translateY_effect_mobile":{"unit":"px","size":"","sizes":[]},"_transform_scale_popover":"","_transform_keep_proportions":"yes","_transform_scale_effect":{"unit":"px","size":"","sizes":[]},"_transform_scale_effect_tablet":{"unit":"px","size":"","sizes":[]},"_transform_scale_effect_mobile":{"unit":"px","size":"","sizes":[]},"_transform_scaleX_effect":{"unit":"px","size":"","sizes":[]},"_transform_scaleX_effect_tablet":{"unit":"px","size":"","sizes":[]},"_transform_scaleX_effect_mobile":{"unit":"px","size":"","sizes":[]},"_transform_scaleY_effect":{"unit":"px","size":"","sizes":[]},"_transform_scaleY_effect_tablet":{"unit":"px","size":"","sizes":[]},"_transform_scaleY_effect_mobile":{"unit":"px","size":"","sizes":[]},"_transform_skew_popover":"","_transform_skewX_effect":{"unit":"px","size":"","sizes":[]},"_transform_skewX_effect_tablet":{"unit":"deg","size":"","sizes":[]},"_transform_skewX_effect_mobile":{"unit":"deg","size":"","sizes":[]},"_transform_skewY_effect":{"unit":"px","size":"","sizes":[]},"_transform_skewY_effect_tablet":{"unit":"deg","size":"","sizes":[]},"_transform_skewY_effect_mobile":{"unit":"deg","size":"","sizes":[]},"_transform_flipX_effect":"","_transform_flipY_effect":"","_transform_rotate_popover_hover":"","_transform_rotateZ_effect_hover":{"unit":"px","size":"","sizes":[]},"_transform_rotateZ_effect_hover_tablet":{"unit":"deg","size":"","sizes":[]},"_transform_rotateZ_effect_hover_mobile":{"unit":"deg","size":"","sizes":[]},"_transform_rotate_3d_hover":"","_transform_rotateX_effect_hover":{"unit":"px","size":"","sizes":[]},"_transform_rotateX_effect_hover_tablet":{"unit":"deg","size":"","sizes":[]},"_transform_rotateX_effect_hover_mobile":{"unit":"deg","size":"","sizes":[]},"_transform_rotateY_effect_hover":{"unit":"px","size":"","sizes":[]},"_transform_rotateY_effect_hover_tablet":{"unit":"deg","size":"","sizes":[]},"_transform_rotateY_effect_hover_mobile":{"unit":"deg","size":"","sizes":[]},"_transform_perspective_effect_hover":{"unit":"px","size":"","sizes":[]},"_transform_perspective_effect_hover_tablet":{"unit":"px","size":"","sizes":[]},"_transform_perspective_effect_hover_mobile":{"unit":"px","size":"","sizes":[]},"_transform_translate_popover_hover":"","_transform_translateX_effect_hover":{"unit":"px","size":"","sizes":[]},"_transform_translateX_effect_hover_tablet":{"unit":"px","size":"","sizes":[]},"_transform_translateX_effect_hover_mobile":{"unit":"px","size":"","sizes":[]},"_transform_translateY_effect_hover":{"unit":"px","size":"","sizes":[]},"_transform_translateY_effect_hover_tablet":{"unit":"px","size":"","sizes":[]},"_transform_translateY_effect_hover_mobile":{"unit":"px","size":"","sizes":[]},"_transform_scale_popover_hover":"","_transform_keep_proportions_hover":"yes","_transform_scale_effect_hover":{"unit":"px","size":"","sizes":[]},"_transform_scale_effect_hover_tablet":{"unit":"px","size":"","sizes":[]},"_transform_scale_effect_hover_mobile":{"unit":"px","size":"","sizes":[]},"_transform_scaleX_effect_hover":{"unit":"px","size":"","sizes":[]},"_transform_scaleX_effect_hover_tablet":{"unit":"px","size":"","sizes":[]},"_transform_scaleX_effect_hover_mobile":{"unit":"px","size":"","sizes":[]},"_transform_scaleY_effect_hover":{"unit":"px","size":"","sizes":[]},"_transform_scaleY_effect_hover_tablet":{"unit":"px","size":"","sizes":[]},"_transform_scaleY_effect_hover_mobile":{"unit":"px","size":"","sizes":[]},"_transform_skew_popover_hover":"","_transform_skewX_effect_hover":{"unit":"px","size":"","sizes":[]},"_transform_skewX_effect_hover_tablet":{"unit":"deg","size":"","sizes":[]},"_transform_skewX_effect_hover_mobile":{"unit":"deg","size":"","sizes":[]},"_transform_skewY_effect_hover":{"unit":"px","size":"","sizes":[]},"_transform_skewY_effect_hover_tablet":{"unit":"deg","size":"","sizes":[]},"_transform_skewY_effect_hover_mobile":{"unit":"deg","size":"","sizes":[]},"_transform_flipX_effect_hover":"","_transform_flipY_effect_hover":"","_transform_transition_hover":{"unit":"px","size":"","sizes":[]},"motion_fx_transform_x_anchor_point":"","motion_fx_transform_x_anchor_point_tablet":"","motion_fx_transform_x_anchor_point_mobile":"","motion_fx_transform_y_anchor_point":"","motion_fx_transform_y_anchor_point_tablet":"","motion_fx_transform_y_anchor_point_mobile":"","_background_background":"","_background_color":"","_background_color_stop":{"unit":"%","size":0,"sizes":[]},"_background_color_stop_tablet":{"unit":"%"},"_background_color_stop_mobile":{"unit":"%"},"_background_color_b":"#f2295b","_background_color_b_stop":{"unit":"%","size":100,"sizes":[]},"_background_color_b_stop_tablet":{"unit":"%"},"_background_color_b_stop_mobile":{"unit":"%"},"_background_gradient_type":"linear","_background_gradient_angle":{"unit":"deg","size":180,"sizes":[]},"_background_gradient_angle_tablet":{"unit":"deg"},"_background_gradient_angle_mobile":{"unit":"deg"},"_background_gradient_position":"center center","_background_gradient_position_tablet":"","_background_gradient_position_mobile":"","_background_image":{"url":"","id":"","size":""},"_background_image_tablet":{"url":"","id":"","size":""},"_background_image_mobile":{"url":"","id":"","size":""},"_background_position":"","_background_position_tablet":"","_background_position_mobile":"","_background_xpos":{"unit":"px","size":0,"sizes":[]},"_background_xpos_tablet":{"unit":"px","size":0,"sizes":[]},"_background_xpos_mobile":{"unit":"px","size":0,"sizes":[]},"_background_ypos":{"unit":"px","size":0,"sizes":[]},"_background_ypos_tablet":{"unit":"px","size":0,"sizes":[]},"_background_ypos_mobile":{"unit":"px","size":0,"sizes":[]},"_background_attachment":"","_background_repeat":"","_background_repeat_tablet":"","_background_repeat_mobile":"","_background_size":"","_background_size_tablet":"","_background_size_mobile":"","_background_bg_width":{"unit":"%","size":100,"sizes":[]},"_background_bg_width_tablet":{"unit":"px","size":"","sizes":[]},"_background_bg_width_mobile":{"unit":"px","size":"","sizes":[]},"_background_video_link":"","_background_video_start":"","_background_video_end":"","_background_play_once":"","_background_play_on_mobile":"","_background_privacy_mode":"","_background_video_fallback":{"url":"","id":"","size":""},"_background_slideshow_gallery":[],"_background_slideshow_loop":"yes","_background_slideshow_slide_duration":5000,"_background_slideshow_slide_transition":"fade","_background_slideshow_transition_duration":500,"_background_slideshow_background_size":"","_background_slideshow_background_size_tablet":"","_background_slideshow_background_size_mobile":"","_background_slideshow_background_position":"","_background_slideshow_background_position_tablet":"","_background_slideshow_background_position_mobile":"","_background_slideshow_lazyload":"","_background_slideshow_ken_burns":"","_background_slideshow_ken_burns_zoom_direction":"in","_background_hover_background":"","_background_hover_color":"","_background_hover_color_stop":{"unit":"%","size":0,"sizes":[]},"_background_hover_color_stop_tablet":{"unit":"%"},"_background_hover_color_stop_mobile":{"unit":"%"},"_background_hover_color_b":"#f2295b","_background_hover_color_b_stop":{"unit":"%","size":100,"sizes":[]},"_background_hover_color_b_stop_tablet":{"unit":"%"},"_background_hover_color_b_stop_mobile":{"unit":"%"},"_background_hover_gradient_type":"linear","_background_hover_gradient_angle":{"unit":"deg","size":180,"sizes":[]},"_background_hover_gradient_angle_tablet":{"unit":"deg"},"_background_hover_gradient_angle_mobile":{"unit":"deg"},"_background_hover_gradient_position":"center center","_background_hover_gradient_position_tablet":"","_background_hover_gradient_position_mobile":"","_background_hover_image":{"url":"","id":"","size":""},"_background_hover_image_tablet":{"url":"","id":"","size":""},"_background_hover_image_mobile":{"url":"","id":"","size":""},"_background_hover_position":"","_background_hover_position_tablet":"","_background_hover_position_mobile":"","_background_hover_xpos":{"unit":"px","size":0,"sizes":[]},"_background_hover_xpos_tablet":{"unit":"px","size":0,"sizes":[]},"_background_hover_xpos_mobile":{"unit":"px","size":0,"sizes":[]},"_background_hover_ypos":{"unit":"px","size":0,"sizes":[]},"_background_hover_ypos_tablet":{"unit":"px","size":0,"sizes":[]},"_background_hover_ypos_mobile":{"unit":"px","size":0,"sizes":[]},"_background_hover_attachment":"","_background_hover_repeat":"","_background_hover_repeat_tablet":"","_background_hover_repeat_mobile":"","_background_hover_size":"","_background_hover_size_tablet":"","_background_hover_size_mobile":"","_background_hover_bg_width":{"unit":"%","size":100,"sizes":[]},"_background_hover_bg_width_tablet":{"unit":"px","size":"","sizes":[]},"_background_hover_bg_width_mobile":{"unit":"px","size":"","sizes":[]},"_background_hover_video_link":"","_background_hover_video_start":"","_background_hover_video_end":"","_background_hover_play_once":"","_background_hover_play_on_mobile":"","_background_hover_privacy_mode":"","_background_hover_video_fallback":{"url":"","id":"","size":""},"_background_hover_slideshow_gallery":[],"_background_hover_slideshow_loop":"yes","_background_hover_slideshow_slide_duration":5000,"_background_hover_slideshow_slide_transition":"fade","_background_hover_slideshow_transition_duration":500,"_background_hover_slideshow_background_size":"","_background_hover_slideshow_background_size_tablet":"","_background_hover_slideshow_background_size_mobile":"","_background_hover_slideshow_background_position":"","_background_hover_slideshow_background_position_tablet":"","_background_hover_slideshow_background_position_mobile":"","_background_hover_slideshow_lazyload":"","_background_hover_slideshow_ken_burns":"","_background_hover_slideshow_ken_burns_zoom_direction":"in","_background_hover_transition":{"unit":"px","size":"","sizes":[]},"_border_border":"","_border_width":{"unit":"px","top":"","right":"","bottom":"","left":"","isLinked":true},"_border_width_tablet":{"unit":"px","top":"","right":"","bottom":"","left":"","isLinked":true},"_border_width_mobile":{"unit":"px","top":"","right":"","bottom":"","left":"","isLinked":true},"_border_color":"","_border_radius":{"unit":"px","top":"","right":"","bottom":"","left":"","isLinked":true},"_border_radius_tablet":{"unit":"px","top":"","right":"","bottom":"","left":"","isLinked":true},"_border_radius_mobile":{"unit":"px","top":"","right":"","bottom":"","left":"","isLinked":true},"_box_shadow_box_shadow_type":"","_box_shadow_box_shadow":{"horizontal":0,"vertical":0,"blur":10,"spread":0,"color":"rgba(0,0,0,0.5)"},"_box_shadow_box_shadow_position":" ","_border_hover_border":"","_border_hover_width":{"unit":"px","top":"","right":"","bottom":"","left":"","isLinked":true},"_border_hover_width_tablet":{"unit":"px","top":"","right":"","bottom":"","left":"","isLinked":true},"_border_hover_width_mobile":{"unit":"px","top":"","right":"","bottom":"","left":"","isLinked":true},"_border_hover_color":"","_border_radius_hover":{"unit":"px","top":"","right":"","bottom":"","left":"","isLinked":true},"_border_radius_hover_tablet":{"unit":"px","top":"","right":"","bottom":"","left":"","isLinked":true},"_border_radius_hover_mobile":{"unit":"px","top":"","right":"","bottom":"","left":"","isLinked":true},"_box_shadow_hover_box_shadow_type":"","_box_shadow_hover_box_shadow":{"horizontal":0,"vertical":0,"blur":10,"spread":0,"color":"rgba(0,0,0,0.5)"},"_box_shadow_hover_box_shadow_position":" ","_border_hover_transition":{"unit":"px","size":"","sizes":[]},"_mask_switch":"","_mask_shape":"circle","_mask_image":{"url":"","id":"","size":""},"_mask_notice":"","_mask_size":"contain","_mask_size_tablet":"","_mask_size_mobile":"","_mask_size_scale":{"unit":"%","size":100,"sizes":[]},"_mask_size_scale_tablet":{"unit":"px","size":"","sizes":[]},"_mask_size_scale_mobile":{"unit":"px","size":"","sizes":[]},"_mask_position":"center center","_mask_position_tablet":"","_mask_position_mobile":"","_mask_position_x":{"unit":"%","size":0,"sizes":[]},"_mask_position_x_tablet":{"unit":"px","size":"","sizes":[]},"_mask_position_x_mobile":{"unit":"px","size":"","sizes":[]},"_mask_position_y":{"unit":"%","size":0,"sizes":[]},"_mask_position_y_tablet":{"unit":"px","size":"","sizes":[]},"_mask_position_y_mobile":{"unit":"px","size":"","sizes":[]},"_mask_repeat":"no-repeat","_mask_repeat_tablet":"","_mask_repeat_mobile":"","hide_desktop":"","hide_tablet":"","hide_mobile":"","_attributes":"","custom_css":""},"defaultEditSettings":{"defaultEditRoute":"content"},"elements":[],"widgetType":"divider","editSettings":{"defaultEditRoute":"content","panel":{"activeTab":"content","activeSection":"section_divider"}},"htmlCache":"\t\t\n\t\t\t\t\t\t\t\n\t\t\t\n\t\t\t\t\t\t\n\t\t\n\t\t\t\t\t\t\n\t\t"}]}](https://heathercullen.com/wp-content/uploads/2026/01/SPY-Weekly-2-1024x534.jpg)
SPYG Charts
SPYG dropped out of its triangle, but looks as though it is trying to get back in there!
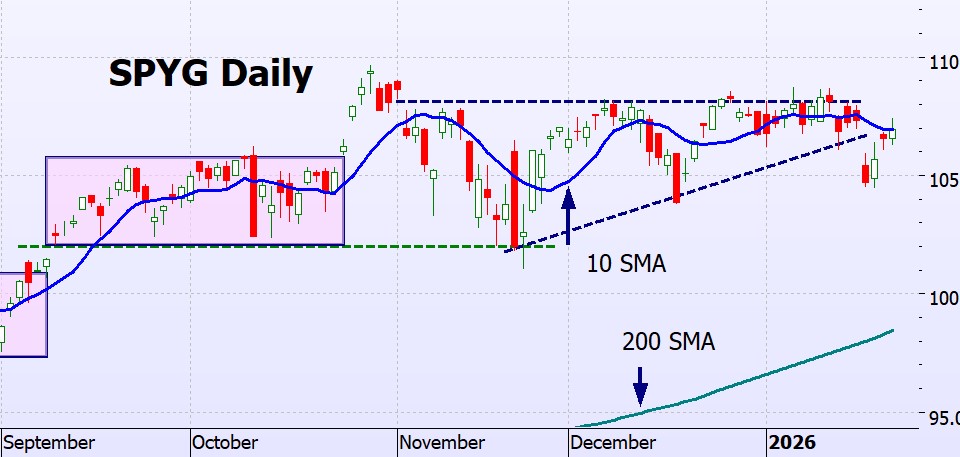
It definitely looks as though it wants to get out of the trading range.
QQQ Charts
The same pattern as SPYG – an interesting aside – see how it bounced off the 100 SMA?
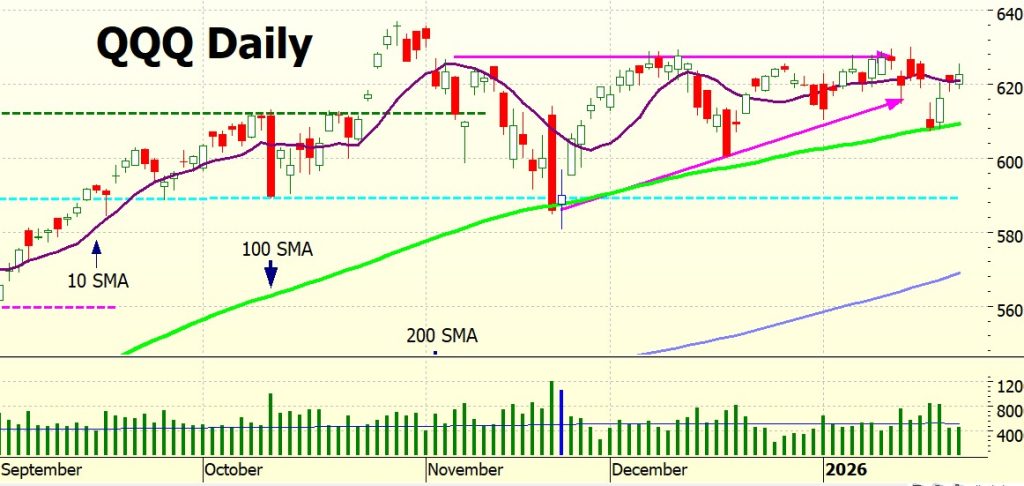
No change in the weekly chart.

VIX (Volatility) Chart
The VIX is retreating from its spike, back into low volatility.

ITMeter

The week ahead
A very busy week:
Monday, January 26
- Data: Durable Goods Orders (8:30 AM ET); Dallas Fed Manufacturing Index (10:30 AM ET).
- Earnings: Steel Dynamics (STLD), Nucor (NUE), Brown & Brown (BRO) — After Close.
Tuesday, January 27
- FOMC: Federal Reserve Policy Meeting Day 1 begins.
- Data: S&P Case-Shiller Home Price Index (9:00 AM ET); CB Consumer Confidence (10:00 AM ET).
- Earnings: American Airlines (AAL), HCA Healthcare (HCA) — Before Open.
- Earnings: Microsoft (MSFT), Texas Instruments (TXN), Starbucks (SBUX) — After Close.
Wednesday, January 28
- FOMC: Fed Interest Rate Decision (2:00 PM ET); Fed Chair Press Conference (2:30 PM ET).
- Data: Advance Durable Goods (8:30 AM ET).
- Earnings: Boeing (BA), ADP, Mastercard (MA) — Before Open.
- Earnings: Tesla (TSLA), Meta Platforms (META), ServiceNow (NOW), IBM — After Close.
Thursday, January 29
- Data: Advance GDP Q4 (8:30 AM ET); Weekly Initial Jobless Claims (8:30 AM ET); Personal Income & PCE Deflator (8:30 AM ET).
- Earnings: Merck (MRK), Comcast (CMCSA) — Before Open.
- Earnings: Apple (AAPL), Amazon (AMZN), Intel (INTC) — After Close.
Friday, January 30
- Data: Employment Cost Index (8:30 AM ET); Chicago PMI (9:45 AM ET); U. Mich Consumer Sentiment – Final (10:00 AM ET).
- Earnings: Chevron (CVX), Exxon Mobil (XOM) — Before Open.
The Futures

The futures are not open yet – it s still Saturday. I am doing this blog early as I am going away for the Australia Day Weekend. Sorry!
Just got back from Esperance – dodged the bushfires – beautiful beaches and surprising stones (yes, a full scale replica of Stonehenge!)

Q & A
Related Posts
- Drawdowns & Losses
Drawdowns and Losses. Finally, a good week. Not before time. And we absolutely deserve it.…
- Covid: Perfect Storm
Covid and the Perfect Storm. Covid affected most of us. I’m not talking about the…


14 Responses
Hello Heather-
Thank you very much for all the great content, really enjoy reading your posts and books. Also just finished watching your awesome interview on Talking Trading. Would love to see more content like that, super helpful.
Question for you, I’ve asked Gemini this as well, but I have had trouble finding DITM calls that satisfy the 1% extrinsic target, even with the VIX lower. I must admit I am not checking all the time, so maybe it’s just my bad timing. Any further advice for me?
Hi Dave – thank you – but it is my pet hate seeing myself on camera – I am way too animated. As for stills – the holdup on the new book is getting a decent head shot of me without my eyes being closed or wearing a goofy expression. Have to do it tomorrow – it is holding everything up.
Re the question – same one as Tyler below (above?)
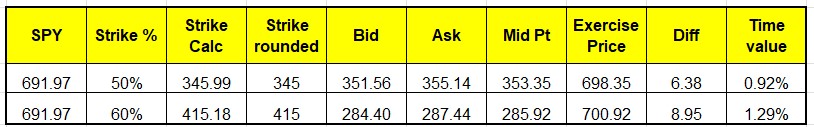
Looking at the September 2026 options chain here the $345 and $415 are 0.92% and 1.29% time value respectively.
I will lost a snapshot of the Excel calcs at the bottom of this Q&A.
Hope this helps.
h
The interview was awesome, should definitely do more, way better than the business network regulars! Just have your agent choose and you won’t have to. I shouldn’t talk I am the same way.
Thanks for looking that up and apologies if I missed it elsewhere in the comments. I just need to look harder. Hope you have a great weekend!
Will keep an eye out for your new book…
Good Evening Heather,
I find your ITM Chat to be refreshing and to the point. What commentary do you read?
Hi Elder, I rarely read financial commentary – it rots your brain, and I am not interested in their opinions, just facts.
I read the ordinary news – and can figure out from that what might impact the markets. I read several sources – WSJ & others from the US, and The Australian, Sky and the ABC (the Australian government-funded leftist echo chamber!) here to get a perspective on things from different viewpoints.
The first thing in the morning I look at Bloomberg to see what happened overnight (Im in Australia right now) – but only for the headline and the actual numbers.
The only commentary I have liked is https://scottgrannis.blogspot.com/ (the Calafia Beach Pundit) as he give a very knowledgeable perspective on financial trends. He posts erratically – he last posted in September, and then didn;t do anything for 3 months – I thought he must have stopped – but then I checked and he is back again with 2 new posts, definitely worth a read.
My suggestion – read / skim several news sources and keep an open mind!
Hope this helps
h
Hi Heather,
I’m so looking forward to your new book. Your approach has been the easiest for me to follow and the only one that has helped me be successful in investing on my own. Thank you for all the advice and being there for your readers. It truly is appreciated. I do have a question for you. With the monies you have invested in unleveraged SPY, do you plan to get out of those shares when there is a death cross?
Hi Charity – thank you, glad you find ITM helpful!
Re the unleveraged SPY options – yes, 10/200 death cross and I am out! I also do QQQ – and this uses a different cross as it is faster-moving than SPY – I’ll explain it all in the new book.
But definitely get out when you see the signal – if it is a false alarm (i.e. a golden cross ensues) there’s no law against buying back in!
Hi Heather,
I also read “Art of the Deal” years ago. I love your content as it is measured and consistent.
Curious, ~% of your overall net worth are your comfortable having in the SPY call options? Does this change over time? Apologies if you have answered this in the past.
Thank you for all you do!
Bill
Hi Bill – thank you, glad you find it useful.
Re how much I have in ITM trades: I have been moving more money into Straight unleveraged SPY shares – that is my ‘Retirement Money’ and it is currently running about 50% unleveraged, 45% DITM and around 5% ATM / OTM.
This is a relatively recent development – it is just that the numbers in the accounts are starting to get so high they are a bit scary, and when there is a bad day on the market I am quite shocked looking at the dollars when the account goes down. Strangely, when it goes up by the same amount I am quite ‘ho hum’ about it.
I find I sleep better at night if I feel that I have limited the possible downside.
This is not something I used to do – until recently I was 100% in ITM trades, and I still would be if I was younger – but I have to face the reality that the market is the only source of income I will ever have now.
So – I would say it depends on your age and the size of the accounts – and what lets you sleep at night. I go into this a bit in the new book – but it is a personal decision based on the size of the accounts, your age and ability to recover from drawdowns.
I hope this helps
h
Hi Heather,
You said “45% DITM”. How deep ITM are they? What is the “strike price/ stock price” right now?
Tyler
Hi Tyler, the same rules as always – 50% strike with 1% time value or 60% strike 2% time value.
So looking at the options chain for September 2026 at today’s prices you could choose:
SPY Strike % Strike Calc Strike rounded Bid Ask Mid Pt Exercise Price Diff Time value
691.97 50% 345.99 345 351.56 355.14 353.35 698.35 6.38 0.92%
691.97 60% 415.18 415 284.40 287.44 285.92 700.92 8.95 1.29%
Sorry, the comments do not let me paste an images, so see if you can make sense of this – I will also post it at the bottom of the Q & A so that you can see it properly.
Hope this helps
h
Hello Heather, could you tell me if there are any updates to your In The Money books? I’ve read all of them, but it’s been about 2 years since I last read them. Has there been any new information added???
HI David, the new book is actually finished anad I am working on the companion website which will accompany the book. Yesm there is new stuff – the Bear Strategy is now different, and there is a new Bull strategy for QQQ. All backtested of course, and audited.
I really wanted to get it done before now, but I have had a changeover of computer that did not go well (thank you Dell (sarc)) that has taken up my time – it was DoA – dead on arrival, and sorting it out has been a nightmare. As well, I am moving house and have to tart up this one to sell – repainting and resanding floors etc.
So – my new deadline is the end of Feb to have everything up and running and the book launched.
Hope this hyeps
h