


Gold Fever: a Bubble?
Gold has rarely been out of the headlines recently. New highs, endless commentary, breathless explanations. Gold is up. Silver is up. Every move is waved away with the same two words: geopolitical uncertainty. That explanation is convenient – and incomplete. In markets, when a story becomes too simple and too widely repeated, we aren’t looking at analysis anymore- we’re looking at a bubble in the making.
Prefer to listen to the podcast?
Anatomy of a Bubble
Bubbles don’t form because of a single catalyst. They form when a narrative becomes dominant, simple, and endlessly repeated. Prices rise, which attracts attention. Attention attracts buyers. Buyers push prices higher, which then “confirms” the story. At that point, price action stops being evidence of the narrative and becomes the narrative itself. It’s a loop:
The Spark: A plausible thesis (inflation, war, debasement).
The Surge: Rising prices attract attention.
The Feedback Loop: Attention attracts buyers, pushing prices higher.
The Saturation: Price action stops being evidence of the story and becomes the story itself.
We’ve Been Here Before
We’ve seen this pattern many times before. The dot-com bubble wasn’t really about profits or even business models; it was about the internet changing everything. Traditional valuation metrics were dismissed as “old economy thinking.” In the mid-2000s housing boom, prices weren’t rising because rents justified them, but because “property always goes up.” Risk disappeared from the conversation entirely.
Crypto
More recently, crypto cycles followed the same script. Early technical discussions gave way to slogans – digital gold, store of value, inevitable adoption. As prices rose, scepticism became unfashionable. Anyone questioning valuation wasn’t analyzing risk; they “didn’t get it.”
The Markets Prices In Uncertainty
Markets don’t wait for certainty; they price it in. Gold doesn’t top when the world becomes safe; it tops when fear is fully priced, participation is broad, and the reasons to own it feel obvious rather than debated.
Today, the explanations for gold’s rise have become vague and elastic. Whether it’s central banks, currency debasement, or war, any news is now used to justify any price move. When skepticism becomes unfashionable and disagreement is dismissed rather than debated, a trend has matured.
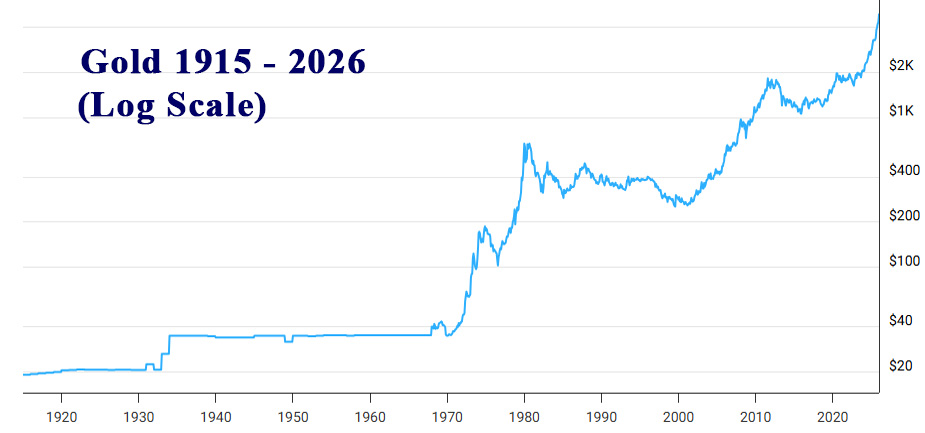
Historical Gold Prices
Gold has a habit of peaking exactly when the narrative feels most “airtight.”
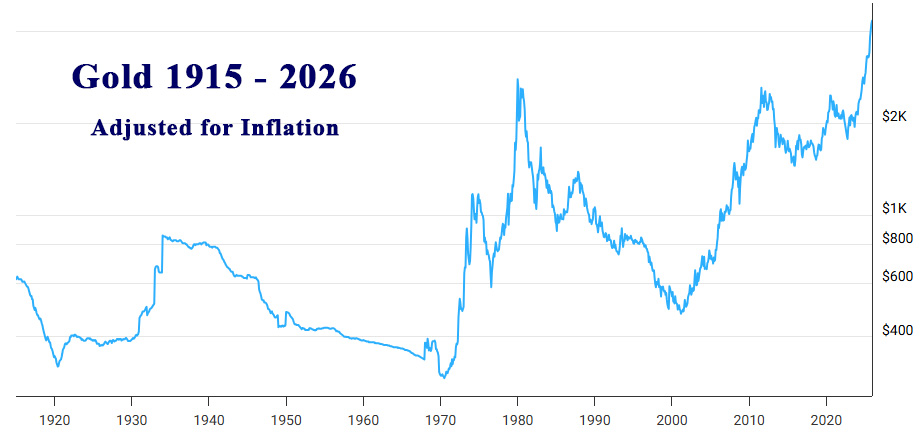
- 1980: Gold surged on oil shocks and runaway inflation. It peaked almost exactly when inflation fears were most intense, then entered a 20-year bear market – even as the original concerns lingered.
- 2011: Post-GFC fears of “money printing” and sovereign defaults drove gold to record highs. It topped just as these fears became consensus, then drifted lower for years despite continued QE.
- 2020: Gold peaked during the Covid period, specifically in August 2020, at around US$2,070–2,075 per ounce (spot price). That high coincided almost exactly with the peak of lockdown uncertainty, emergency rate cuts, massive fiscal stimulus, and “money printing” headlines.
Gold & Covid
What’s interesting is what happened after:
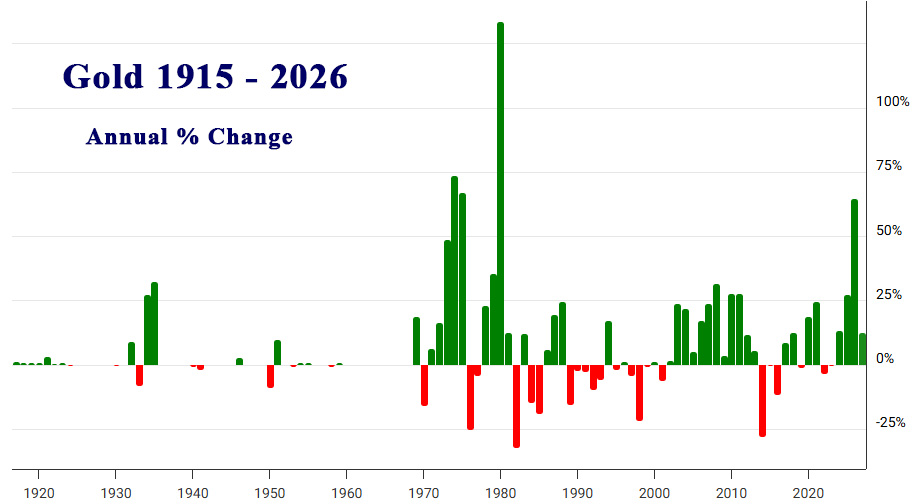
- 2021: Gold failed to make a sustained new high. Despite continued QE, low rates, and ongoing Covid disruptions, prices drifted lower and traded sideways.
- 2022: Inflation surged to multi-decade highs — the very scenario gold is supposedly built for — yet gold still underperformed for much of the year.
- 2023–2024: Only later did gold break decisively higher again, well after the original crisis had passed.
That behaviour mirrors earlier gold peaks closely. In 1980, gold topped near the height of inflation panic. In 2011, it topped near the height of post-GFC fear. In 2020, it topped near peak Covid uncertainty. In each case, the top occurred when the risk felt most acute, not when it was later “confirmed” by data.
That’s a useful reminder for today. Markets don’t wait for certainty. They move ahead of it. By the time an explanation is universally accepted – lockdowns, inflation, war, central banks – price has usually already done most of the work.
What Now for Gold?
The common thread with bubbles and late-stage trends more generally is that the catalyst is real. The story makes sense. But by the time it dominates headlines and becomes the default explanation for every price move, most of its power has already been absorbed by the market.
Gold doesn’t need to crash to fit this pattern. But history suggests that when gold ownership becomes unquestioned, returns tend to be front-loaded – not ahead.
Gold Collapse?
This doesn’t mean gold must collapse tomorrow. Bubbles often last longer than expected and go higher than seems reasonable. But the behaviour is familiar: relentless media coverage, simplified stories, late-arriving retail interest, and the quiet disappearance of scepticism.
Markets don’t peak when things are bad. They peak when the story feels obvious. And right now, gold is starting to feel obvious.

Gold Footnotes
Footnote 1: I drafted this blog on Thursday after watching the news where they were talking about ‘gold’s unstoppable rise’ – and made a mental note to investigate shorting it. Left it too late – it dropped over 10% before I did it! Sigh. Timing is everything.
Footnote 2: If you look at a long-term gold chart, the price looks like a flatline until 1971. That was because it was a fixed price. Under the Gold Standard, the U.S. Dollar was pegged at $35 per ounce. Gold wasn’t a “trade”- it was the anchor of the system. Only after Nixon “closed the gold window” in 1971 was gold allowed to float, birthing the volatility and “fever” cycles we see today.
To the markets . . .
A strange week. The futures always seemed to be up promising a good day, then a disappointing day followed.
SPY Charts
SPY has been going sideways for all of 2026 – in fact it has been going sideways since October 2025. Boring It seems inclined to stay above the top of the Darvas box level at around 690. I’ve mentioned before that getting over 700 might take some time as it is a big round number and the market often hesitates before breaching them – but I think it has hesitated long enough, time for it to make a move. (Not that the market ever listens to me!)
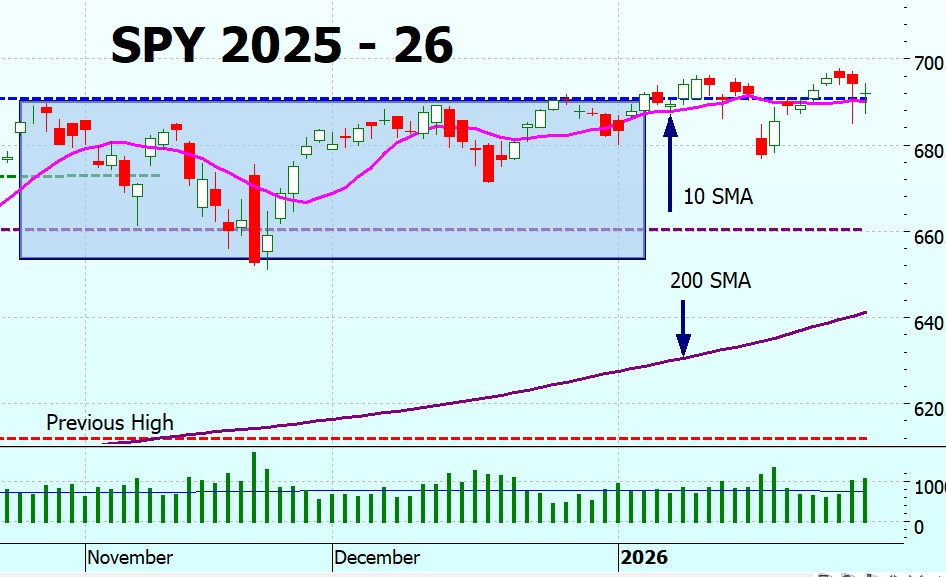
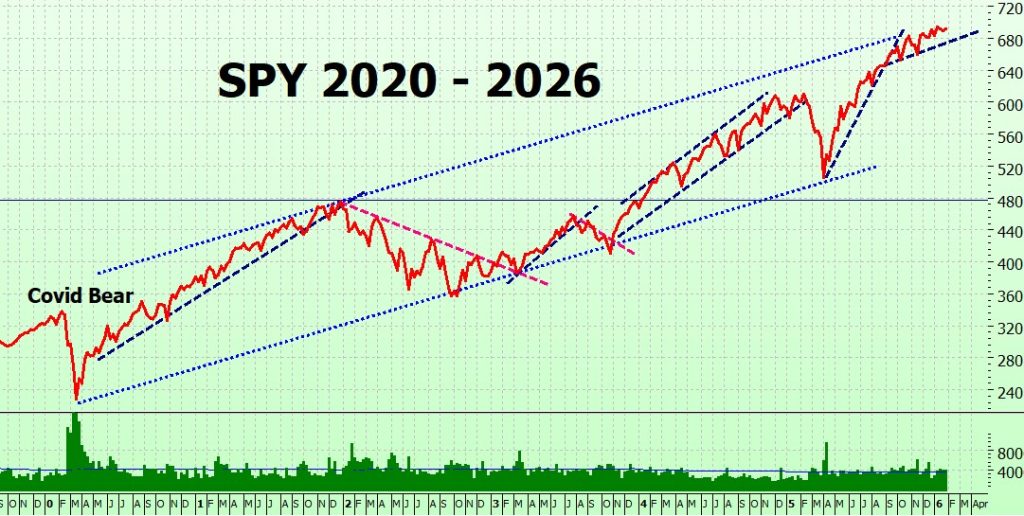
On the weekly chart, it looks as though the upper bound of the 6-year trading channel is holding (the upper blue dotted line) and the new uptrend we drew in (the short navy dashed line) may form a new trading channel. If it holds then we may get over the 700 level in the next month or so.
SPYG Charts
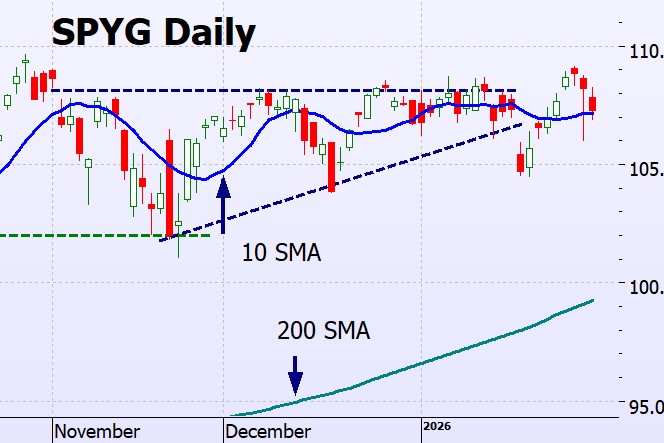
SPYG has also been going sideways since October. The ascending triangle we drew in is looking increasingly useless and SPYG has broken out both on the downside and the upside! That’s the trouble with drawing lines on a chart – the market doesn’t care about our lines!
Does that mean they are useless? No. They are just to help us make sense of what the market is doing and it is often accurate – but not always (as in this case).
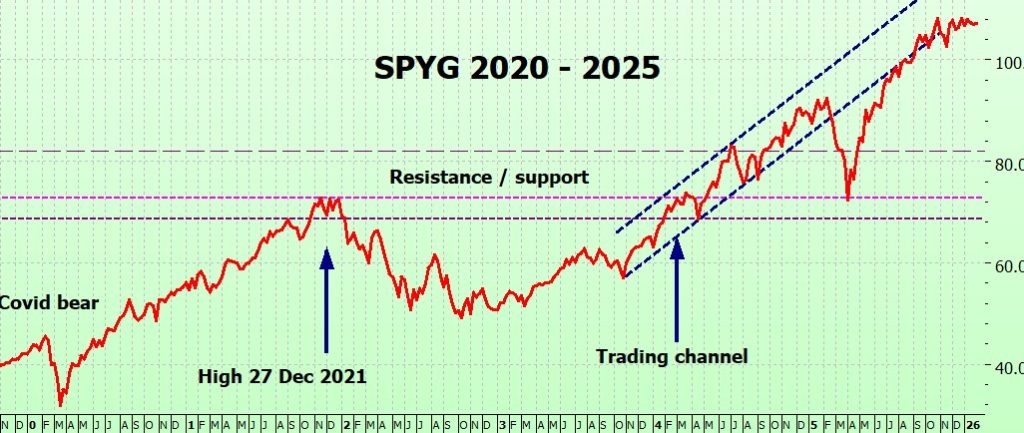
On the long term chart it is clear that SPYG is right out of the 2023 – 2025 trading channel, but it is too early to draw in a new one.
QQQ Charts
QQQ has also been going sideways since October. Like SPYG it has broken out of the ascending triangle on both sides! I’ll remove it for next week.
Interesting how it is bouncing off the 100 SMA – in November, December and January. A teaser: in the new book which will be out in the latter half of February I have a completely new strategy for the bear, and also a strategy for QQQ which does not use the SPY parameters. You can probably guess that the 100 SMA is involved. I started putting it on the charts some weeks ago, expecting to be queried about why I was doing it, but no-one seems to have noticed!
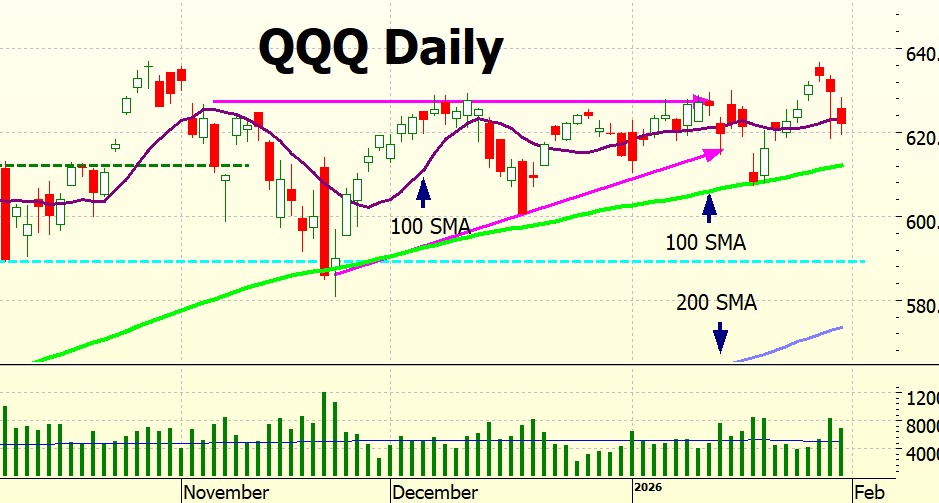
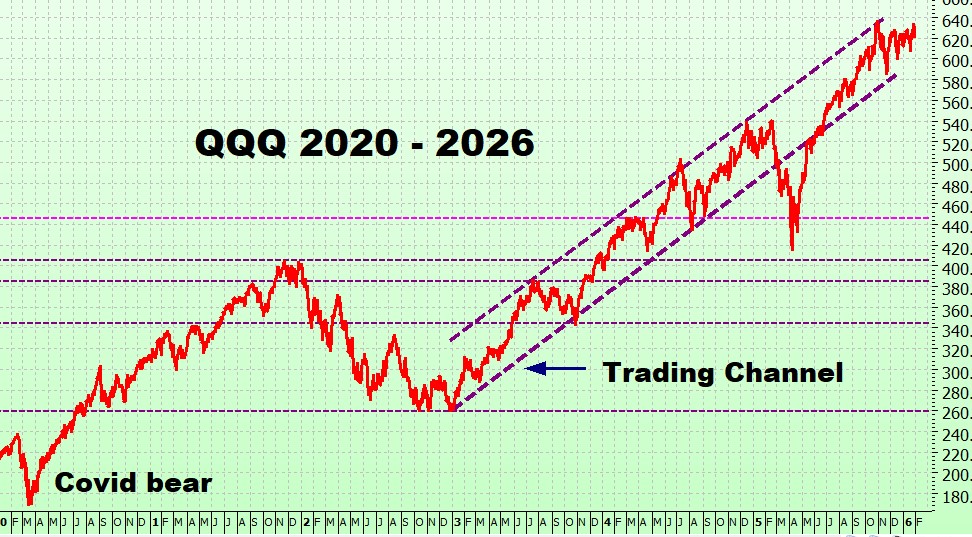
On the long term chart QQQ is still in the middle of the 2022 – 2026 trading channel.
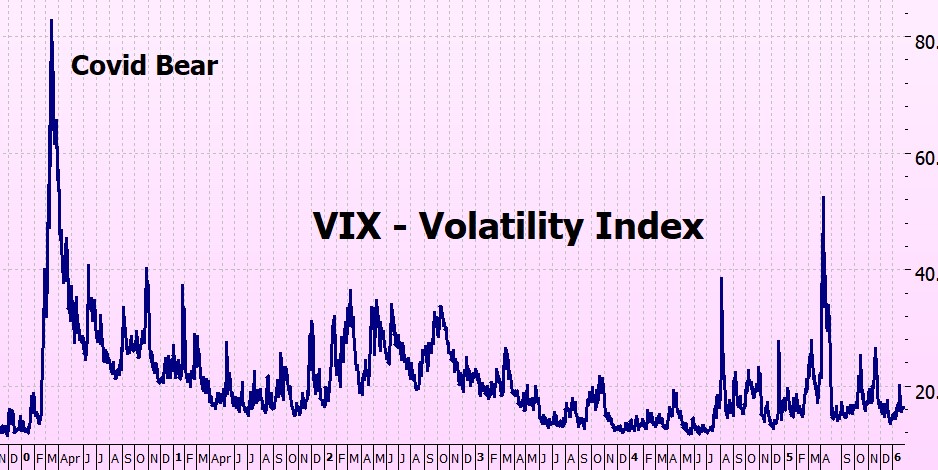
VIX Chart (Volatility)
Volatility is still low. (under 20)
ITMeter

The week ahead . .
A busy week ahead, lots of earnings reports and data.
Monday, Feb 2
- Earnings: Walt Disney (DIS) , Palantir (PLTR), Simon Property (SPG).
- Data: ISM Manufacturing PMI
Tuesday, Feb 3
- Earnings: Merck (MRK), PepsiCo (PEP), Pfizer (PFE); AMD, Amgen (AMGN), Chubb (CB)
- Data: JOLTS Job Openings
Wednesday, Feb 4
- Earnings: Eli Lilly (LLY), AbbVie (ABBV), Boston Scientific (BSX) Alphabet (GOOGL), Qualcomm (QCOM)
- Data: ADP Employment Report and ISM Services PMI
- Announcements: Treasury Quarterly Refunding (how much debt the US government plans to issue.)
Thursday, Feb 5
- Earnings: Philip Morris (PM), Uber (UBER), ConocoPhillips (COP), Amazon (AMZN), Gilead (GILD)
- Data: Weekly Jobless Claims
Friday, Feb 6
- Data (The Big One): Nonfarm Payrolls / Unemployment Rate (8:30 AM) (expect high volatility as this dictates Fed sentiment.)
- Sentiment: U. of Michigan Consumer Sentiment
The futures . .
The futures are looking particularly dismal – but lets not despair. Lsst week they often looked really good then a big red candle day followed. It is still 12 hours to market open
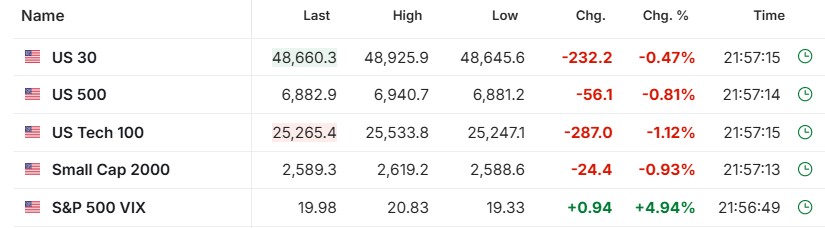
Fingers crossed for a good week!
Heather
Trade the tide – not the waves
Q & A
Related Posts
- Gold Bulls
Gold Bulls. Gold has had a bit of a bull run recently. Quite a vertical…


4 Responses
Dear Heather,
I’m very much looking forward to your new book. And yes—I did notice the new 100 SMA on the QQQ chart, but I chose to wait patiently and see what insights you’d reveal about it.
A quick question: at the end of each blog post, you include a screenshot of the futures. If I understand correctly, you don’t actually trade them. Since I’m not very familiar with futures, could you briefly explain what purpose they serve for you and what information you extract from them?
In your books, when comparing the backtested results of the different strategies, you clearly show how the Golden and Death Cross help control the losses of ITM options, since they are leveraged. Out of curiosity, I applied the same in/out signals directly to the SPY ETF (starting with $10,000 at inception), and I also tested a slightly more sensitive SMA. In both cases, buy‑and‑hold still came out ahead.
Does this imply that Golden/Death Cross signals don’t really add value for a long‑term ETF savings plan—and by extension, for individual stocks? The question of applying these in/out signals to other ETFs or equities comes up frequently, and based on this small test, it seems they may offer little benefit in that context.
~ Marijana
Hi Marijana!
The futures? no, I don’t trade them, just look at them for an indication of what the market is going to do on open. Although I must say they are getting less and less reliable!
Re the golden and death crosses on SPY shares – actually, using the ITM signals gives around 50% more return – it is in my book ‘Timing the Market’ which is not about options just how ITM beats buy-and-hold.
Not sure how you were doing the backtesting? And over what time period?
If you don’t already have a copy of Timing the Market please get back to me and I will send a free copy of the eBook.
Hope this helps
h
Hello Heather, a couple of questions please. 1) I landed on the backtesting page from the Bull Market book but I don’t see any hyperlinks to click on. ? 2) I bought the Kindle version in Mar 2023 but I see there is a 2024 edition. How do I purchase that edition? Thanks!
Hi Randy
1) If you clock on the Backtesting link in the footer on any page you will come to the backtesting pages. They have recently been updated to support the new definitive book that is coming out shortly so it doesn’t exactly match what was in the old books.
2) yes there is a 2024 edition – but the 2026 version should be out within a couple of weeks so I suggest that you wait for thet.
I will annouce it on the blog, and there will be special prices fpr blog readers.
Hope this helps.
h