


Is it a SaaSpocalypse?
It has bothered me for some time that technology stocks are all lumped together. “Tech” has become one of those lazy market labels and covers everything from cloud infrastructure to social media advertising to electric cars to semiconductor factories.
The Magnificent Seven
We need look no further than the ‘Magnificent Seven’. It includes Tesla. Is Tesla a tech stock? Or a car manufacturer? I would go for the latter. And really, how much does Amazon have in common with Nvidia? Or Apple with Meta?
Too Much AI Spending?
Tech stocks took a dive this week. The explanation was familiar: “spending too much capital on AI.”
But the real weakness showed up elsewhere – in software companies that may be replaced by AI, not helped by it.
It’s spawned a new term . . .
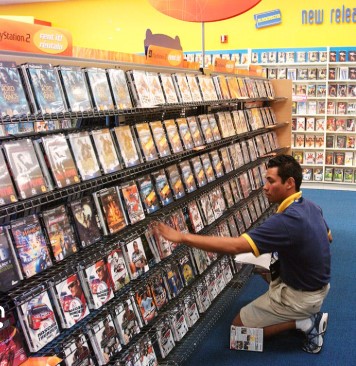
The 'SaaSpocalypse'
By 2015, SaaS (Software-as-a-Service) had become the default model for new business software and is the dominant delivery model for enterprise applications (Salesforce, SAP, MS 365, Quickbooks etc).
The narrative to date has been ‘AI will help these companies work faster’ – but that has suddenly flipped.

Now it is ‘AI will replace the need for their software entirely’. The stocks that were hammered last week weren’t the ones building AI, but the companies who had built ‘data fortresses’ and had a ‘seat based’ pricing model.
So, what actually happened?
Anthropic - Claude Cowork

Anthropic released new Claude plugins last month to automate legal and compliance work, designed to handle complex professional workflows that many software and data providers sell as core product. The market saw seat-based software becoming extinct and panicked:
- Thomson Reuters (TRI): Plunged -15% to -18% in a single session. As the owner of major legal research tools, it was seen as ground zero for AI disruption.
- RELX (owner of LexisNexis): Dropped -14%. Like Thomson Reuters, their “seat-based” pricing model is at risk if an AI agent can do the work of five junior associates.
- Wolters Kluwer: Fell -13%. They provide high-margin legal and compliance software that Anthropic’s new tool aims to automate (contract review, NDA triage, etc.).
- LegalZoom (LZ): Saw a massive hit, dropping nearly -20% as investors feared their business model for basic legal documents could be “superseded” by a simple folder of AI prompts.
Owning the Workflow

Investors suddenly realized that that if AI could automate tasks previously requiring specialized, high-cost software, then the value proposition of those legacy providers had fundamentally changed.
After all, if a law firm can use a $30 / month AI agent to review 100 contracts, they might stop paying for 20 “seats” of expensive legacy legal software.
Winners Vs Losers
The market is finally beginning to distinguish between three distinct tiers of the AI economy:

- Enablers (Infrastructure): The semiconductor giants and cloud providers building the “foundries” of AI. These are the companies pouring billions into CAPEX. (NVDA, TSMC, AVGO)
- Integrators (AI as an add-on) : Companies that are using AI to improve their existing business. Think TSLA, AAPL, COF that are embedding AI into physical products or ecosystems.
- Legacy SaaS (AI as a replacement): Companies that provide “workflow” or “seat-based” software. They are currently being hit because investors fear AI agents will either replace the human workers who use the software or perform the software’s task directly. (Think RELX, CRM, TEAM)
By lumping these together, investors are inadvertently buying the disrupted alongside the disruptors.
The Bottom Line
What does it mean for the market? Well, I think the ‘tech’ label outlived its usefulness. I have said many times that I think AI will prove even more transformational than the Internet.

I think we are just at the start of this transformation. When I first used AI a couple of years ago I quickly realised that IT was going to change forever – coding would be like writing with a quill pen. And I keep discovering new ways to use it and see how it could transform business.
OK, OK . . . but the market?
As always, the commentary will be endless. Analysts will explain with great confidence what nobody understood last week. But I think it is gradually dawning on them the “tech” label is way too broad.
The next decade won’t be tech vs non-tech. It will be AI enablers, AI integrators . . and AI casualties.
And as always, the market won’t care about the story. It will care about the price.
You’ll notice that companies like Nvidia (NVDA) and Broadcom (AVGO) recovered almost all their losses by Friday, Feb 6, while the Legacy software names stayed down.
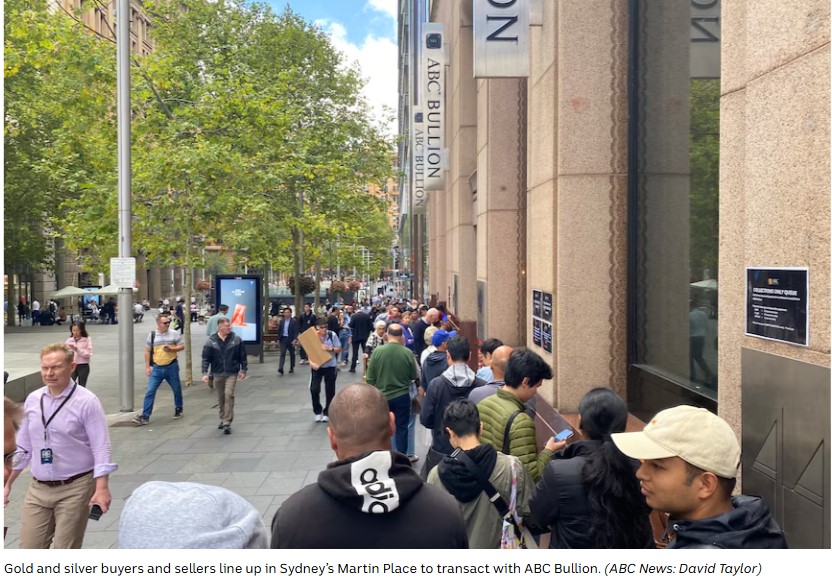
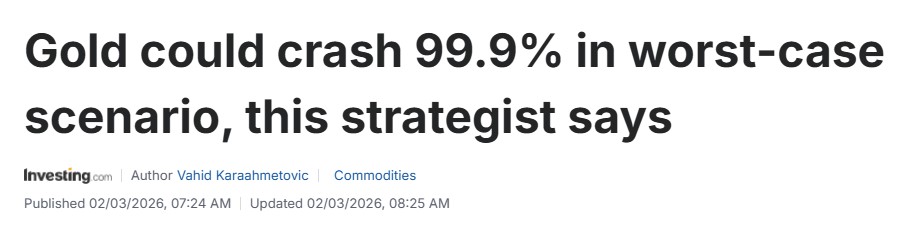
Gold Fever
Just before we go to the markets I saw these headlines and thought they might amuse you. Gold Bubble anyone?
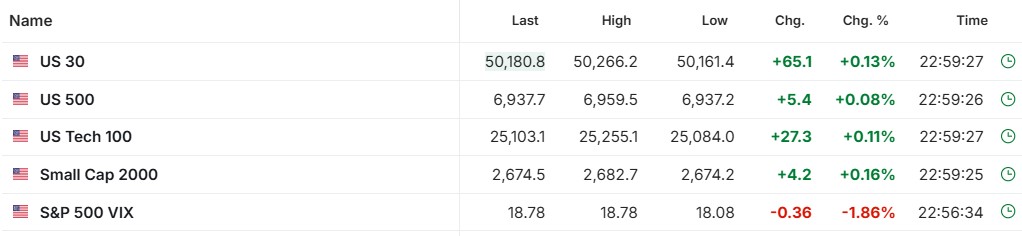
To the markets . . .
As we have just seen, the big tech drop dominated the market last week, but essentially not much has changed.
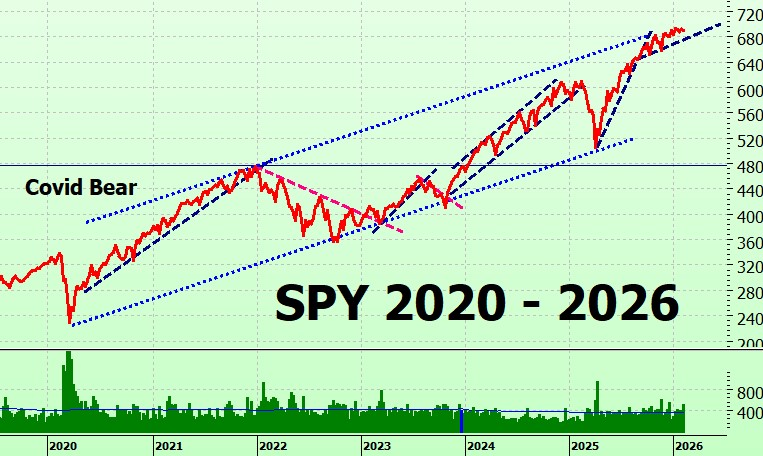
SPY Charts
SPY continues on its merry sideways path – four months now. Boring. Really nothing to say about it.
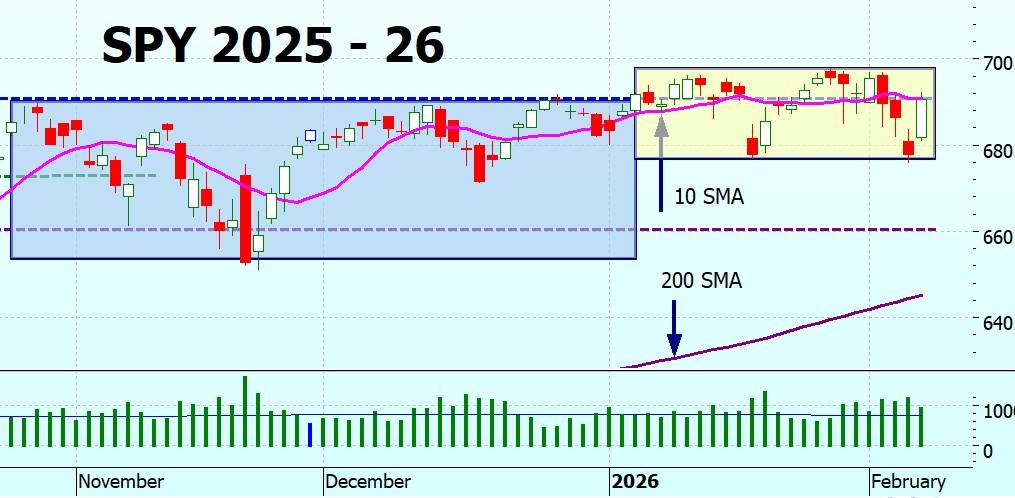
The long term chart is similarly boring.
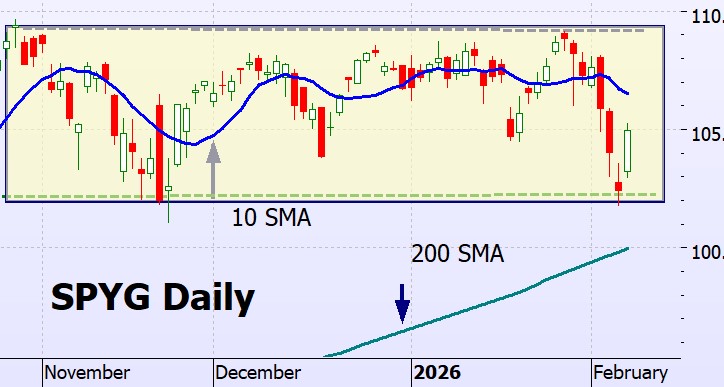
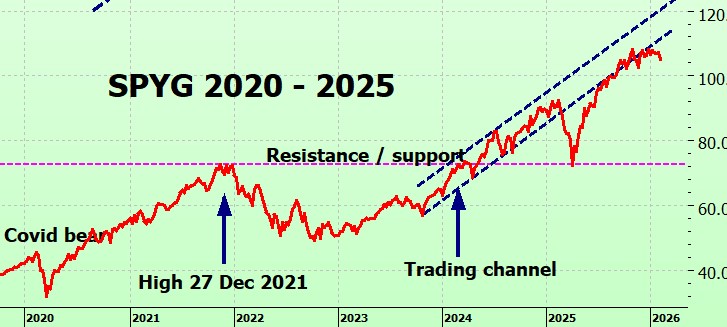
SPYG Charts
Like SPY, SPYG is stuck in a sideways trading range.
On the long term chart it shows no inclination to get back into the trading channel.
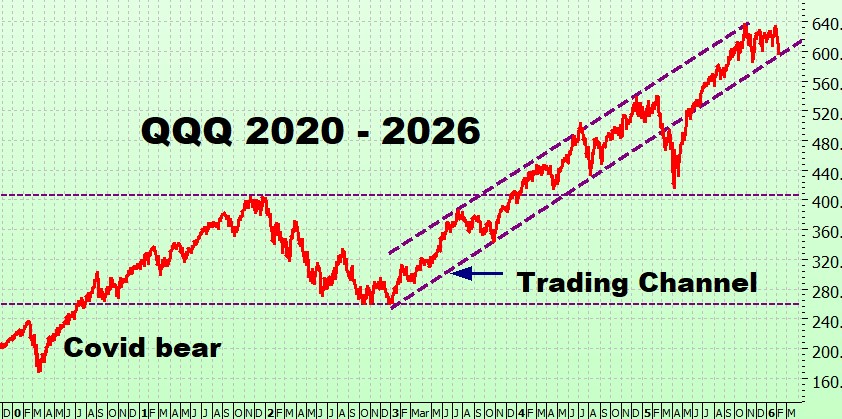
QQQ Charts
QQQ has also been trading sideways for months. Some tech stocks are doing brilliantly, some terribly, so it averages out to a nothingburger. The sooner there is a shakeout of the SaaS companies the better.
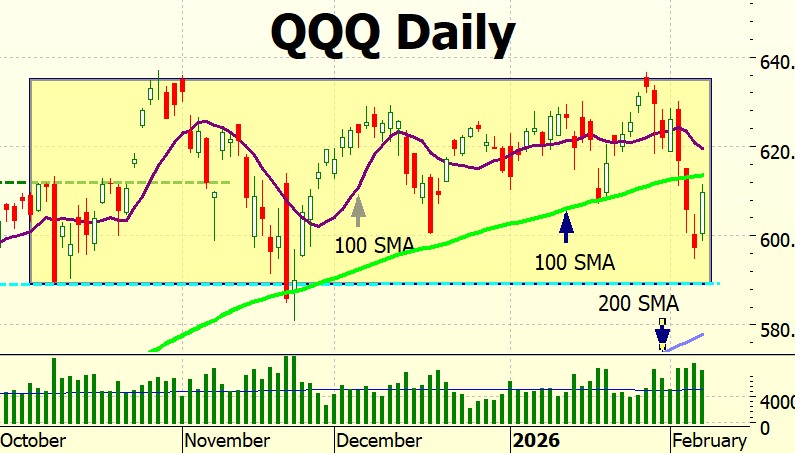
And on the long term chart QQQ seems to have bounced off the lower bound of its trading channel. Encouraging sign.
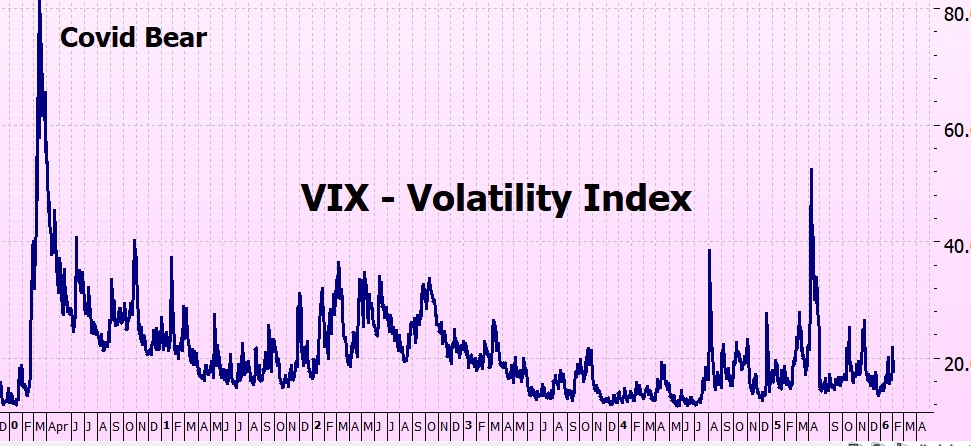
VIX Chart (Volatility)
The VIX has been having one of its regular hiccups.
ITMeter

The week ahead . .
Apologies. Now corrected. The date confusion was due to the U.S. Government Shutdown (Jan 31 – Feb 3, 2026), which forced the Bureau of Labor Statistics to reschedule their reports into this one “Super Week.”
Here is the correct and finalized schedule for this current week:
Corrected Market Calendar: Feb 9 – Feb 13, 2026
Monday, Feb 9 (Today): * Activity: “Fed Monday” with multiple Governors speaking (Waller and Bostic).
Earnings: onsemi (ON).
Tuesday, Feb 10: * Data: Employment Cost Index (8:30 AM ET).
Earnings: Coca-Cola (KO) and Spotify (SPOT); Cloudflare (NET) (After Hours).
Wednesday, Feb 11: * The Big One: January Jobs Report (8:30 AM ET). Rescheduled from last week.
Earnings: Cisco (CSCO) (After Hours).
Thursday, Feb 12: * Earnings: Applied Materials (AMAT) (After Hours).
Friday, Feb 13: * The Big One: January CPI (Inflation) (8:30 AM ET). Rescheduled from earlier in the week.
The futures
Since there is a market holiday tomorrow we still have 36 hours to market open. The futures are slightly positive.
The best laid plans . . .
‘o mice and men gang aft agley. My Scottish heritage again! Two weeks ago I had an accident and tore the tendon off the hip bone on my right leg. Initially misdiagnosed, I have now had surgery to fix it – which leaves me having to walk with crutches and not drive for 6 weeks! Not happy.

This was a busy time for me – getting the new book published, selling my current house and moving into a new place.
However, such is life – so apologies if I haven’t been answering emails and questions as fast as I would like. And I always wonder how people get injuries so in case you are curious – it was nothing exciting, trying to catch a runaway supermarket trolley in a sloping car park. Rugby tackling it didn’t work.
Finger crossed for a good week!
Heather
Trade the tide – not the waves


16 Responses
Dear Heather,
This coming week is so special because Valentine Day and President Day and Lunar New Year and Ash Wednesday and First Day of Ramadan are coming together in the United States of America.
Thank you so much for sharing your knowledge and wisdom and understanding regarding the stock market. You remind me so much of Cathie Wood and Michael Burry and Charles Munger a Warren Buffett.
I am forever grateful and thankful to you and the people of In The Money community.
Sincerely,
George Henry Charles
Thank you George Henry – how lovely of you!
x
h
Oh Heather! Wishing you a speedy recovery.
Thank you Ben. I’m not good at not getting out and about so time is really dragging, but such is life!
x
h
Oh no! I’m hoping you have a speedy recovery. I’d say the good thing with the sideways trading is the 200 sma is catching up to the 10 sma as they are approaching one another. This would make a sell signal require less of a drop in the market should we get one. My current options expire in June so I’m hoping the uptrend would continue before then. I have both your ITM Bull and Bear books. I find the Bear one is not as easy to implement than the Bull. Thankfully I haven’t yet needed to.
Thank you-Anthony
HI Anthony – thank yu – and yes, you are right about a smaller drop – but I am still hopeful of a bull run. Ever the optimist!
Re the bear book – please don’t persevere with it – the new book has a new and easier strategy for the bear market – not so fiddly. It explains how ITMB was developed and the reason why it had to be superceded.
All will be clear soon as soon as I publish!
Hopefully by end Feb.
x
h
Dear Heather,
Health is Wealth. Please take good care of yourself and live until 90s and 100s. Our mother is 88 this year. Speaking of Gold, I am wondering if you can buy Gold in Costco in Australia?
Hi George Henry – well, my great grandmother lived to 97 so I am planning on emulating that!
I have no idea about Costco – I wouldn’t imagine you can buy gold through it as the only place I know of is the Perth Mint.
Seems crazy – isn’t Costco a supermarket? and you can buy gold?
h
Dear Heather, I’m so sorry to hear about your accident and the initial misdiagnosis—that sounds really tough. Wishing you a smooth and speedy recovery! Take it easy with those crutches, and I hope the next six weeks fly by so you can get back to driving and feeling like yourself again. Sending positive vibes your way!
Thank you Vojtech – positive vibes gratefully received!
Thank you!!
x
h
Hi Heather…I’ve read all your books, and I’m interested in trading SPY using ITM. My question is this: I’m interested in paper trading to see how I’m doing, but to do so I need historical data, i.e., option chains for SPY going back 3 or 4 years. However, I can find historical charts, but I can’t find historical option chains. So how am I supposed to practice? I look forward to your reply and appreciate your help! Thank you–Greg
Hi Greg,
Good question — and it comes up a lot. Unfortunately, full historical option chains aren’t freely available in the way price charts are. The exchanges sell that data, and most brokers only provide live chains or limited history.
The good news is that you don’t actually need complete old option chains to practice ITM properly. ITM is driven by the market signal (the chart rules), not by hunting down exact historical option quotes.
For paper trading, you can model the option leg very closely using SPY price history plus the standard ITM assumptions:
50% strike calls/puts → assume roughly 1% time value
60% strike calls/puts → assume roughly 2% time value
These time value estimates weren’t guessed — they’ve been checked and re-checked across many years of real SPY option chains and are remarkably stable for deep ITM options. The strategy outcome is dominated by the market move, not small fluctuations in premium.
So if SPY is at 500, the 50% strike option is around the 250 strike, and you simply add ~1% time value to the intrinsic value. That gets you extremely close for practice purposes.
If you want the most realistic practice, the best approach is to paper trade forward using live option chains on your broker platform — that’s how most people build confidence before committing real money.
Hope this helps,
Heather
Thanks for the detailed reply, which I will put to good use.
Wishing you a speedy recovery!–Greg
Thank you!
The week ahead is off a week. Yes we notice. No it is no big deal.
Good luck with the hip and the move! That sounds quite difficult- hire all the help, you are worth it! I even hired someone to set up my kitchen last time we moved. It was a blessing.
Hi Kate – all corrected now – the givt shutdown had messed up my dates but I should have double checked.
All fixed,
x
h