Red candles. War headlines. Oil surging. The perfect environment – not for a market crash – but for your brain to sabotage you. Our logical brain – the one that understands the ITM strategy – often gets pushed aside by something much older and much louder. And that’s when things can go off the rails.
The Emotional Reptile
In the ITM books, we briefly went into the ‘structure’ of the human brain:
Of course, we like to think that we are always rational, but when red candles dominate and the news turns grim, logic often hands over the wheel.
The End of the World!
When fear kicks in, it triggers a biological chain reaction. The amygdala (limbic) fires an alarm, the hypothalamus activates the fight-or-flight response (reptilian), and suddenly your body is preparing for danger – heart racing, palms sweating, adrenaline pumping.
Panic!!!
At that point, your brain isn’t managing a portfolio. It’s trying to survive a threat.
That’s when the “logical” finger hits Sell – not because the ITM strategy said to, but because your survival wiring demanded it.
Sound familiar?
The Iran Situation
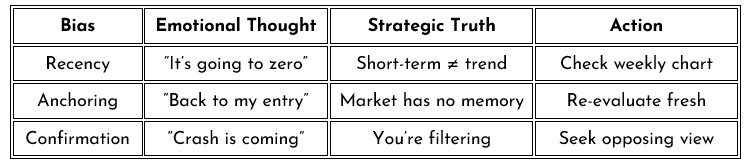
Currently, we are seeing this play out in real-time. With the military conflict in Iran, disruption in the Strait of Hormuz, spikes in oil prices, constant negative headlines – the “End of the World” narrative is easy to find. But for a disciplined trader, the real danger isn’t the event. It’s the psychological cocktail it creates: Recency, Anchoring, and Confirmation bias.
Recency
Recency bias is the tendency to give disproportionate weight to the most recent events while ignoring long-term data. When markets fall after days of negative headlines, the brain assumes the trend will continue indefinitely.
Anchoring
Anchoring occurs when you fixate on a specific price point—usually the peak of the market or your own entry price—as the “true” value of an asset. But the market does not have a memory. Only traders do. By anchoring to the past, you stop trading the chart in front of you and start trading a ghost.
Confirmation Bias
Once fear takes hold, the brain stops asking “What’s true?” and starts asking “What supports my fear?”
A Quick Check
But what do we DO???
You can’t stop fear. It’s biological. The goal is to stop fear from making your trading decisions. Recognise what’s happening: your brain is trying to protect you by exaggerating recent events, clinging to old prices, and searching for confirmation of danger.
Because when the world feels like it’s ending, the chart usually tells a different, more nuanced story. So instead of reacting to headlines, let’s look at what the charts are actually telling us.
To the markets
An even more dismal week. Why can’t everyone just play nice so that we can get on with trading? Ok, just joking, Markets don’t care about what we’d prefer – they respond to reality. And right now, reality is messy. I am not trying to make light of the situation – but don’t you just long for some peace and quiet? Although I seem to remember a few weeks ago I was complaining because nothing was happening. Hmmm. Getting what you wish for . . .
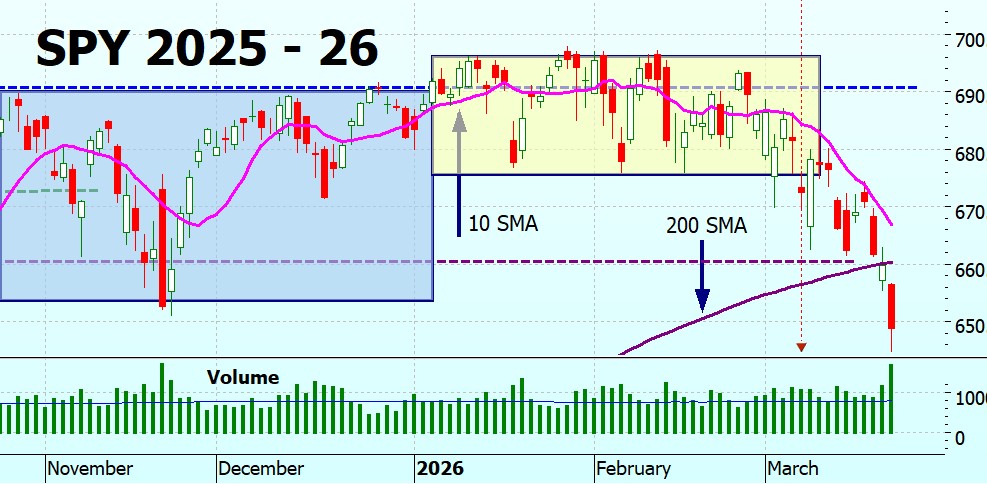
SPY Charts
It’s not looking good. There is probably an imminent death cross, and that (when confirmed) will be our OUT signal.
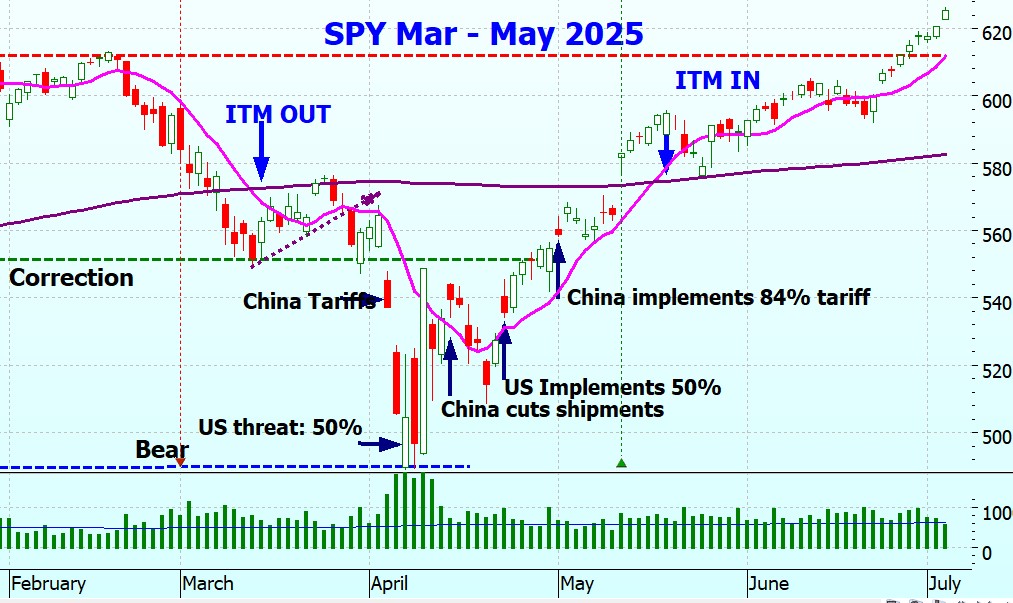
It reminds me of this time last year – when we got a death cross in March and so ITM missed all the April pain when the market was flirting with the bear (which we briefly touched intraday) and reentered in May when it was all over.
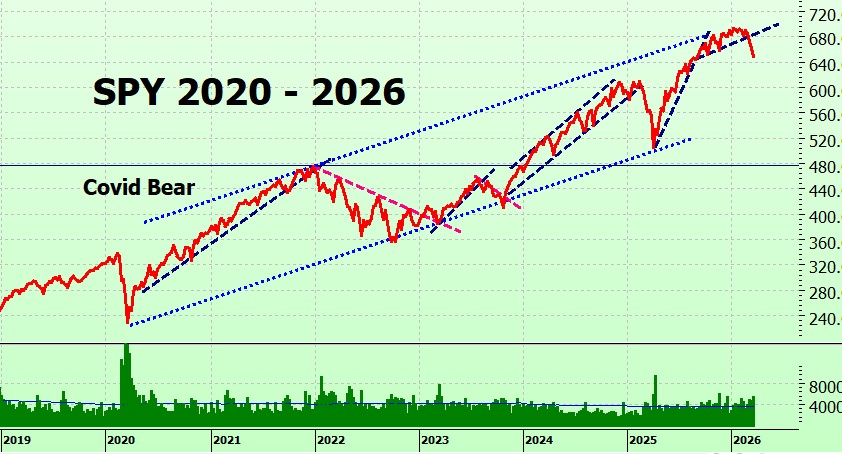
On the long term chart SPY is heading south. Right now it is in the middle of the trading channel established since 2020. If it heads to the lower bound (as it did last year) then we would be looking at a drop to 580 – 600.
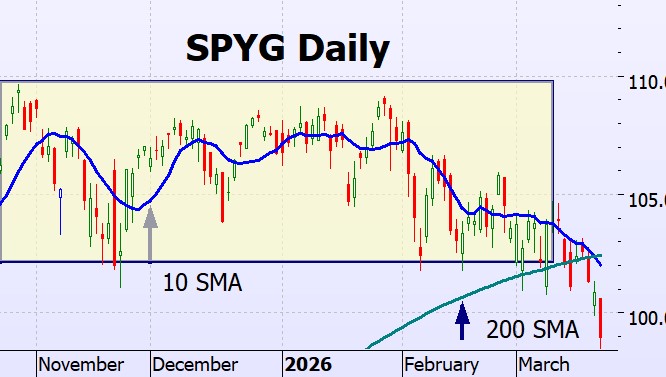
SPYG Charts
Not good news – we have a death cross, and it is confirmed. Time to exit SPYG trades.
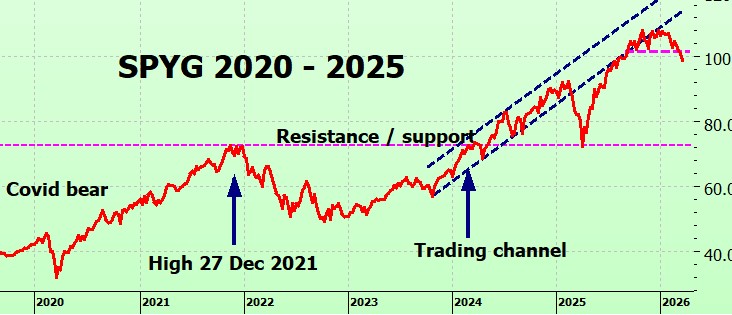
The long term chart confirms the diagnosis:
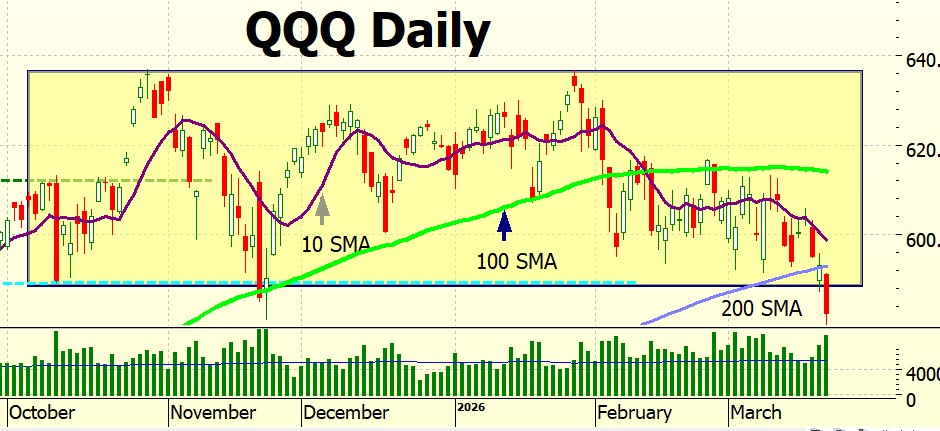
QQQ Charts
We got out of QQQ some weeks ago. I still am finding it hard to believe that it is going down while AI is such a success story – but the charts don’t lie.
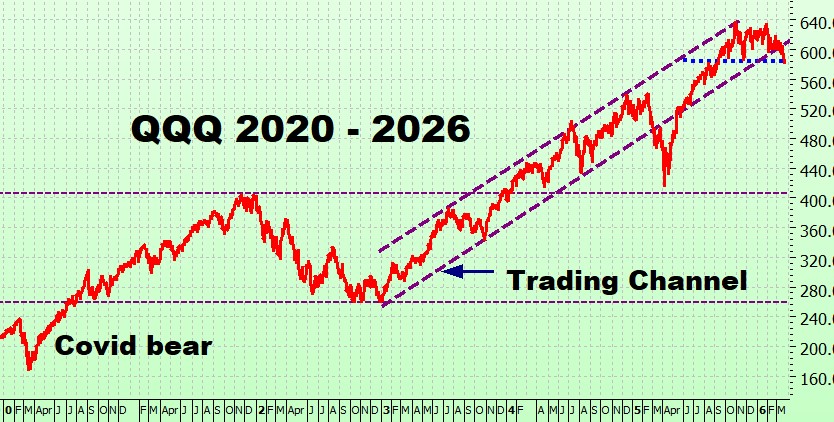
Confirmed by the long term chart – looks like it is breaking the blue support line.
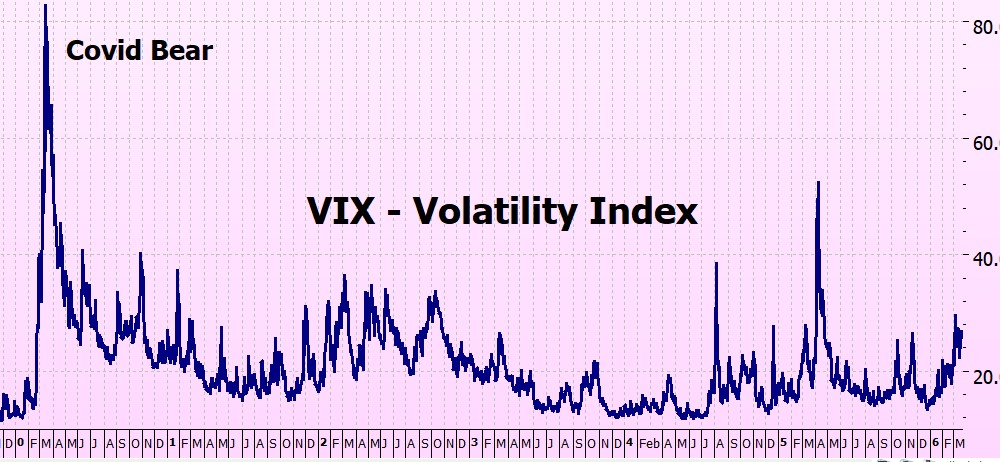
VIX Chart (Volatility)
Elevated volatility, but not as much as last year . . . yet.
ITMeter
Hmmm . . .no one told me I had the ITMeter around the wrong way last week . . .perhaps no-one takes any notice of it? Rethinking this now.
The week ahead . .
Obviously, the war in Iran and what’s happening in the Strait of Hormuz will dominate the market – but here is what else is happening:
Monday – March 23 • PMI (Manufacturing & Services) flash data released. • Early snapshot of business activity and economic momentum.
Tuesday – March 24 • Consumer Confidence Index. • Key read on sentiment and potential spending trends.
Wednesday – March 25 • Durable Goods Orders. • Insight into business investment and demand for big-ticket items.
Thursday – March 26 • Initial Jobless Claims and Final Q4 GDP (revision). • Labor market health and confirmation of economic growth trajectory.
Friday – March 27 • Core PCE Price Index (Fed’s preferred inflation gauge). • Markets likely to focus heavily on inflation signals and policy implications.
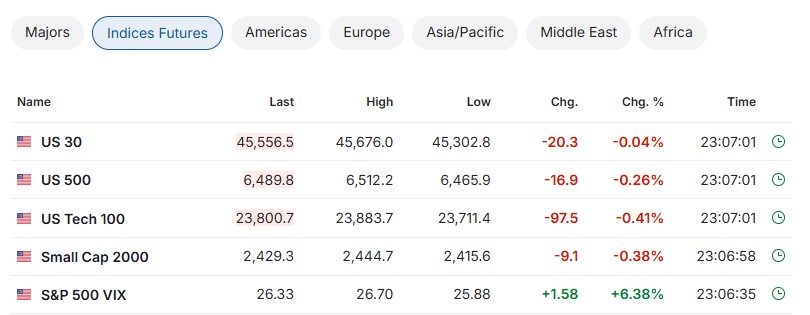
The Futures
Not looking good, but not disastrous.
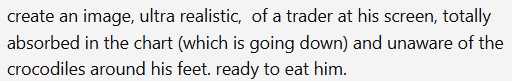
Some light relief
After the dismal charts I thought this may amuse you. I asked AI to generate a header image to illustrate the reptilian brain. Here’s the instructions:
Fingers crossed for a good week!
Heather
Trade the tide – not the waves
Q & A
19 Responses
Hi Heather,
Thanks again for doing those blogs, especially during those times when the market is hard/bad. I noticed we got out on QQQ when the 10 crossed the 100 SMA, but on spy we are waiting for the 10 to cross the 200 SMA? When I read the book I think I remember the OUT signal to be 10 crossing the 200 on both SPY and QQQ but I could be wrong. I read it over a year ago.
Hi Ruben
up until this forthcoming book I haven’t recommended QQQ as I hadn’t backtested it fully – plus I wanted to keep the strategy uncomplicated so stuck with SPY and SPYG. I didn’t make any secret that I traded QQQ myself, just that it wasn’t part of the ITM strategy.
I always include it in the blog as it is such a large part of the market so it is important to keep an eye on it.
I backtested QQQ last oct / nov so that I could include it in the new book – and discovered the best cross to use, and it is quite different to the 10/200. When, a few weeks ago, we hit the unpublished QQQ OUT signal I was in a quandary – what to tell people? If I said ‘here’s the new strategy’ before it was published i would have been inundated with questions and that would take time away from getting the book out and the website ready – so I decided just to tell people that there was an OUT signal and I would explain it all later.
I hope that was the right decision!
x
h
Thanks for clarifying it. Cant wait for the new book.
Perhaps a good time for a QQQ strategy when the signal returns!
Bloomberg notes that tech’s pullback leaves the Nasdaq’s forward price to earnings valuation premium over the S&P 500 at just 4.4%, the smallest since January 2019. As recently as October, the premium stood at 35.7%.
Wow Michael – that one hell of a statistic!
I’ve been thinking for a long time that tech is getting crushed unreasonably. Yes, SaaS is definitely in its death throes – but all the AI stuff I’ve been banging on about is just in its infancy, but getting punished along with SaaS.
My guess is that when the Iran war has an end in sight then we’ll start to see some optimism back in the market – right now we’re definitely in pessimism, and as a natural optimist I find it uncommfortable!
x
h
Dear Heather,
Thank you for your confirmation for SPYG. I closed all my SPYG options.
HI George Henry – yes, we’re all out now. In everything. I wish everything would settle down so that we can het back to trading – but I guess we just have to be patient (and I’m not very good at that!)
x
h
What if my spy options are already losing money? Is there value in waiting out the “war”? Or should I get out with the death cross. All opinions are welcome.
Hi Debra. I know it feels as though you should have baled some time ago – we’re all brilliant traders in hindsight.
I often get asked: why don’t we have a different get OUT signal? Why use the same one fo OUT and IN?
I know a lot of people are thinking that right now and I will do next week’s blog on it.
All I can say is that I have exhaustively backtested and that the ITM strategy beats all the others hands down – but not in every time period, over the longer term. You can always find months where we have lost money.
I’ll try to address it in the next blog.
In the meantime – if you are in SPY (as both QQQ and SPYG have had OUT signals) then another bad day will probably give us the OUT signal and the pain will end!
h
Stick to the plan and some worrying about it. It works out in the long run.
H
Before the bell Trump announces a delay!
Of course… thats the way things work.
R
and read ‘The Art of The Deal’ – it is really informative on how President Trump’s mind works wrt deals.
It has made a lot of things more clear to me.
x
h
H
What a difference a day makes…
R
hey Randy – yes – but still we are being buffetted by the waves!
Can’t see the way forward just yet.
x
h
My first job out of college was as a pilot. Your body can deceive you when flying in weather. You train yourself to BELIEVE AND RELY ON YOUR INSTRUMENTS, I think investing is much the same, you train yourself by learning all you can- that is how you stick with the data when others panic. . I have had itchy fingers wanting to sell to avoid the retreat we have been experiencing, but that is not supported by the data. Heather thanks so much for all the work you put in, it is much appreciated. And having a clear plan and a specific signal helps my emotional state. We are emotional beings, MASTERING OUR FEELINGS is such an important skill in life. Peace be with you.
Hey Kate – yes I’ve done some single-engone flying myself – and that mask they put on so that you can’t see out the windscreen, only the instruments – terrifying!
But necessary.
Yes, watch the instruments!
x
h
Thanks. As always, interesting perspective. It’s hard to hang on. When will the new ITM book be released?
Hi Yu!
Yes, it’s hard – I realize that.
But if you had run backtests as often as I have you’d feel more calm.
Yes, in every downturn there were better places to get out (at the high, obviously!) But that’s with hindsight – which doesn’t work with objective testing.
All I can say – is look at the results.
That’s what works – not every year, not every downturn but overall.
x
h
and sorry – last bit – hopefully in next 2 weeks – waiting for final proofs to arrive.
x
h