


What a week to publish a book!
Could there be worse timing? The SPY golden cross has been confirmed, and that is our IN signal. Yes, we will be buying in at a higher price than we sold. Not ideal – the ITM OUT signal gets us out early if things deteriorate. But not all dips become corrections, and not all corrections become bears.
But the volume?
Yes, it is still low, and I am as twitchy as anyone else about entering a trade on such low volumes. Half of me screams: ‘Wait for a pullback’ but my other half is blunt: ‘you know the system works so follow it’.
So I thought I would review the recent golden crosses, so that you can see how this has played out before.

Last Year’s Dip (2025)
This is perhaps the closest we are going to get, as it was an external shock (the tariffs) and no one was quite sure what was going to transpire.
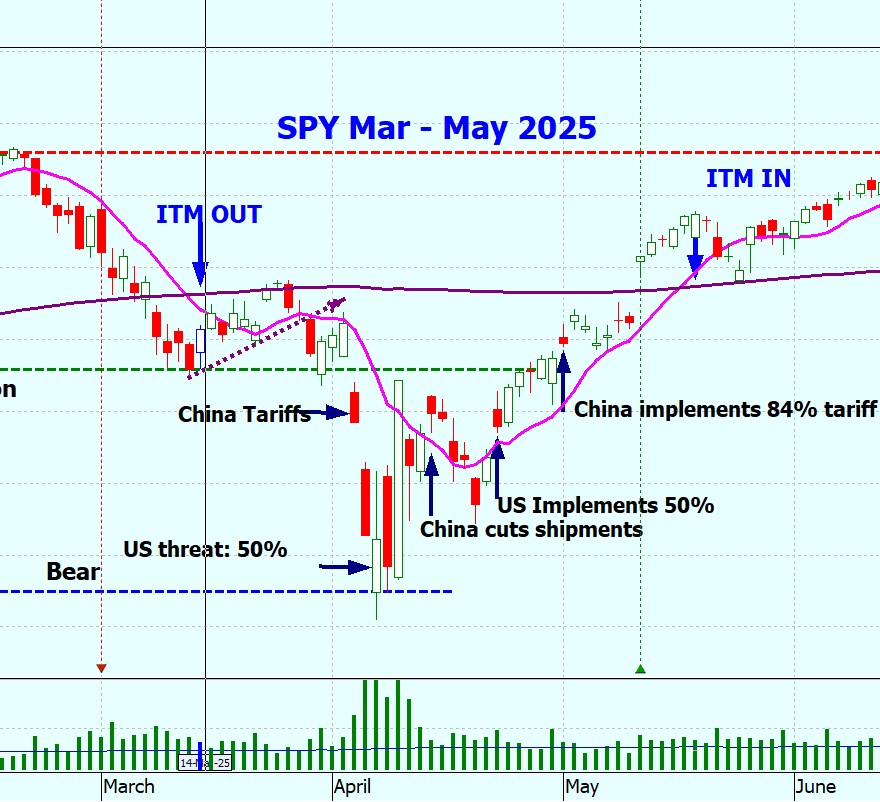
The recovery was abrupt, and soon reached a golden cross, and continued going up on average volume. We were then in a bull trade for the next ten months.
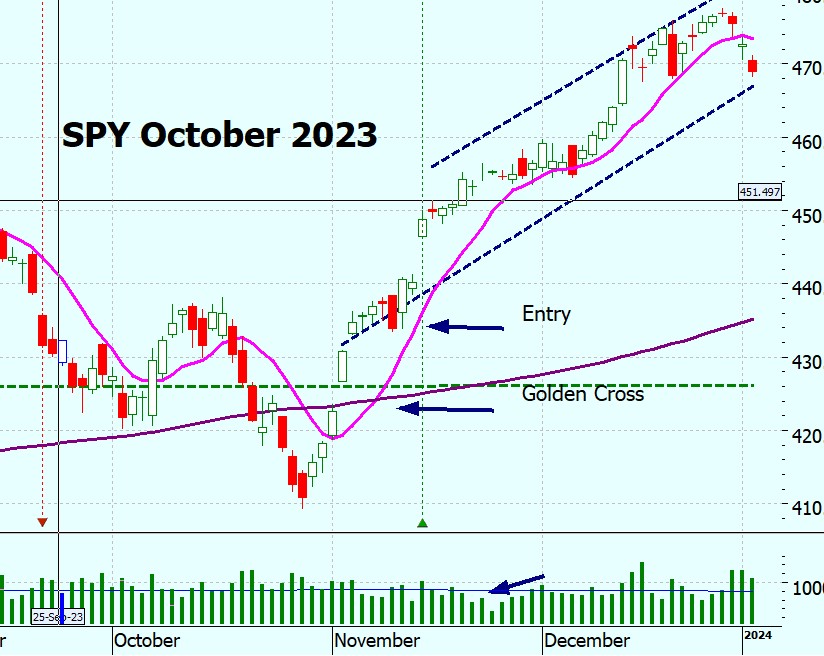
October 2023
This is showing a similar pattern to today, with a very abrupt rise and on below average volume.
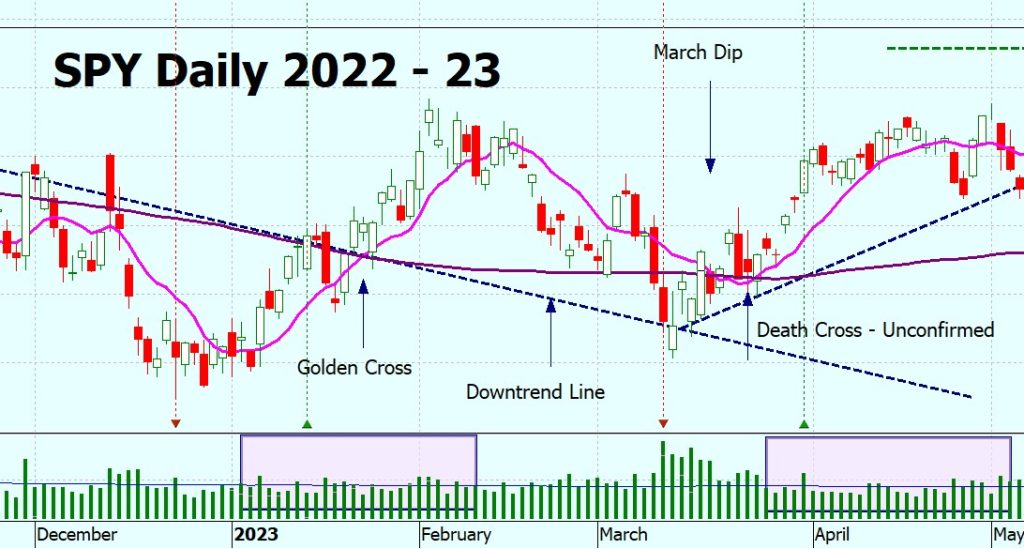
December 2022
This was an interesting time. Our golden cross came in January and the market went up on lower than average volume. The rise was short lived, however, dropping back to a death cross two months later – BUT the death cross did not complete. SPY rose again – and again on lower than average volume.
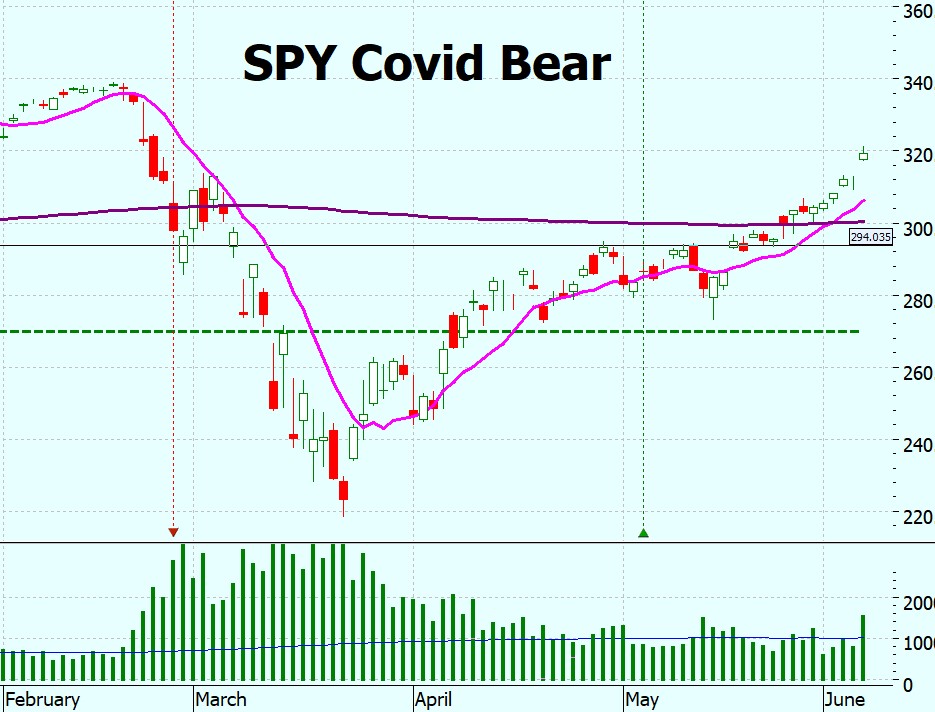
March 2021 (Covid)
The market recovered nicely, and again on lower than average volume.
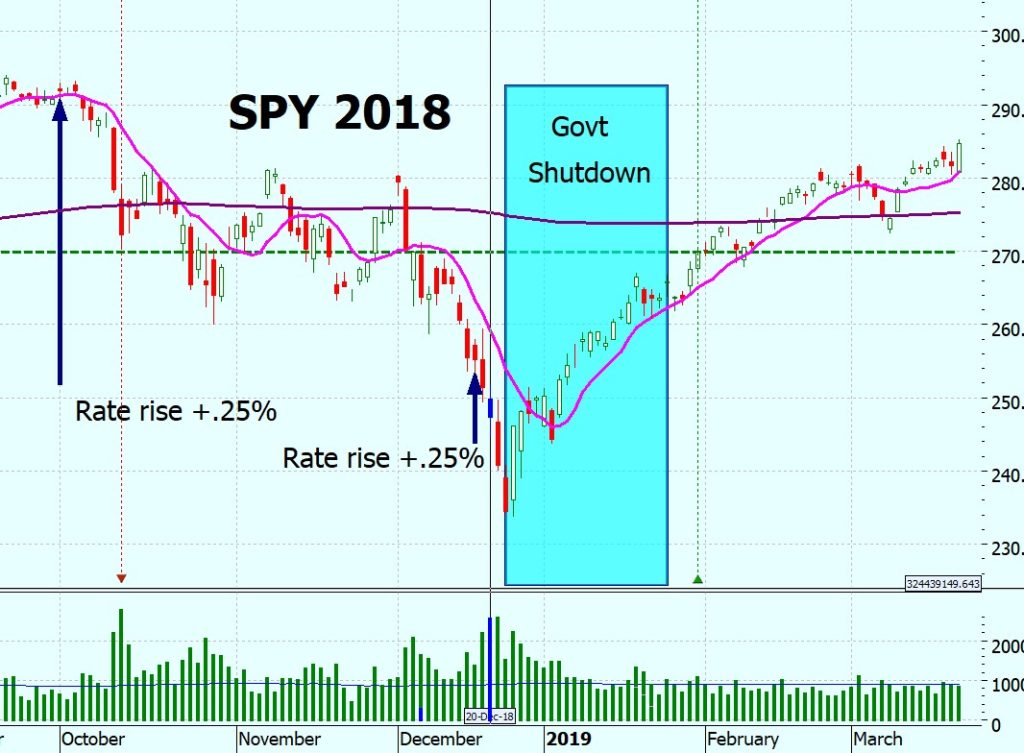
December 2018
The ‘almost bear’ – also shows the same pattern. High volumes on the way down, low on the way up.
Higher averages
Part of the lower than average volume can be explained by the volumes increasing hugely during the falls – this is especially so in the covid recovery, where the average volume after the bear is significantly higher than before.
So what does it mean?
The ITM IN Signal has been confirmed. Here are your choices:
- Follow the IN signal, knowing that ITM performance over the years is excellent, and being prepared to get out again if the market heads south.
- Hold off, thinking that the market will pull back and get in at a later date.
- Hybrid – use a portion of your capital (say, half), and leave the other half in cash to be used later.
Your Decision
Your decision depends on your time horizon and if you are prepared for the possibility of short term pain. As you know, not all ITM trades are winners;
- Over the last 33 years we have had 12 winners and 4 losses.
- The average win was 77% / 95% (50% / 60% strike)
- The average loss was 7% / 8%.
We also have had times when we got out of the market only to get back in again because ITM makes sure that we are out of the market if it looks like it is going to drop further – but it doesn’t always. Not every dip turns into a bear.
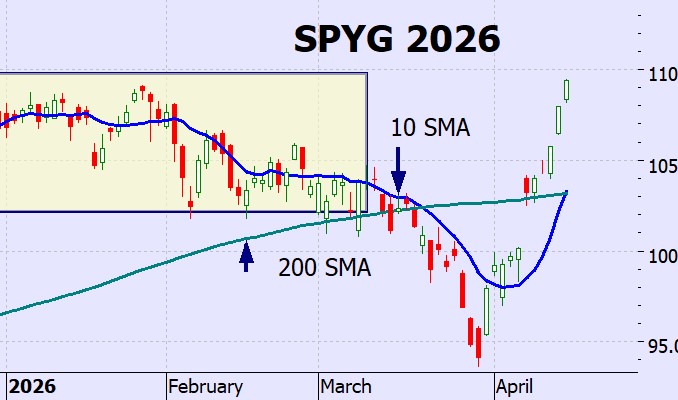
SPYG
Is also forming a golden cross – as yet not confirmed. The SMAs will have to be $1.50 apart for it to be confirmed
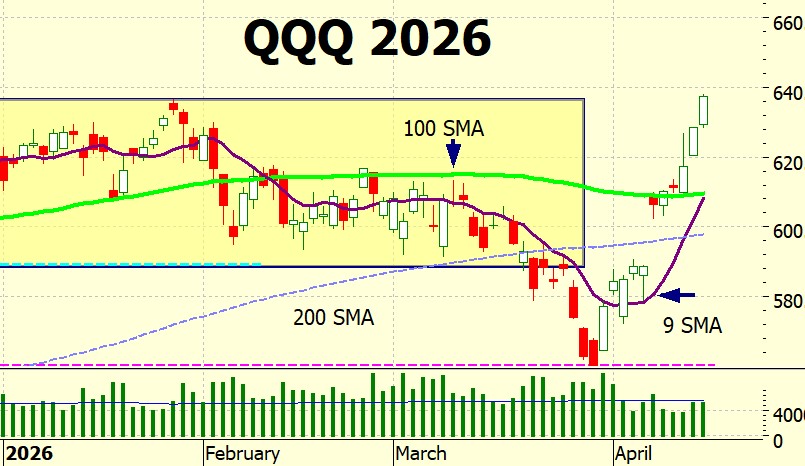
QQQ
QQQ is also forming a golden cross. When the SMAs are $4.65 apart then it will be confirmed.
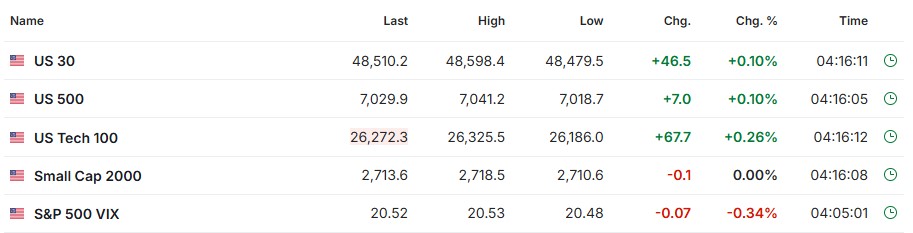
The Futures
Are looking OK, but as always we are at the mercy of war headlines. It does seem to be settling down, and is the ‘new normal’ – the VIX is only marginally above 20.
So much for the quiet week I was going to have after the book was published!
Heather
Trade the tide not the waves

Q & A
Related Posts
- A Dismal Week
What a dismal week! According to the press it has been the worst week since…
- Some Big Waves This Week!
Some Big Waves This Week! A new market high on Monday, then 2 very nasty…
- Crazy Week!
What a crazy week! It started with an attempted assassination and ended with a global…


30 Responses
Per Randy’s inquiry about a lower cost QQQ alternative.
Take a look at QQQM. I’ve traded it ala ITM method with some success.
Appears it will now go better with the 9/100 criteria.
QQQM follows QQQ closer than SPYG follows SPY.
Currently, QQQM 20 day avg. vol = 3.1 mil. Not massive, but spreads are manageable.
Cheers.
Hey John – thank you!
I have a lot of homework to do tomorrow!
x
h
Have you done any backtesting the ETFs SMH or XLK?
Jack
Hi Jack
quick answer – no, haven’t backtested these.
There are a lot of ETFs that track SPY / QQQ but the main problem with them is the low volume / OI which means wide spreads.
It is something I will cover in thi week’s blog as quite a lot of people have been asking for alternatives.
x
h
Hi Heather, I’m currently reading the Kindle version of your new book and have put my hobbies on hold to get through it end-to-end — there’s something about it I find genuinely exciting, maybe the hope of financial freedom one day. I’ve also read your previous book and have been following your strategy since June 2023, so thank you for the work you put into sharing this. One quick question: in the section “ITM SPYG Backtesting > Results: 60% strike,” the maintenance plan says to roll up when the strike drops to 58%, not 55%. I wanted to flag it in case it’s a typo. Thanks again!
Hi Jason – oh golly, you are probably right.
I will check tomorrow and confirm exactly what the backtesting said.
Honestly, you proof and proof but somethin always seems to get away from you – mental scotoma I think!
x
h
Was a referral from a friend .cant wait to read it
I would like to receive Monday,s notifications
HI Peter
hope you like it – and you are on the list.
x
h
Hi, Heather!
Up above you wrote: “QQQ is also forming a golden cross. When the SMAs are $4.65 apart then it will be confirmed.”
$4.65 ???
(By “it will be confirmed”, I assume you mean the QQQ ITM IN signal will be confirmed, since the cross is confirmed when the SMA 9 >= SMA 100 at close.)
The SMA 100 closed at $609.98 on April 15th. So if the SMA 100 remained about the same, wouldn’t the QQQ ITM IN signal be confirmed when the SMA 9 – SMA 10 >= 1.5% = approx $9.15 ?
Thanks!
Stephen
HI Stephen – you are probably right but my brain is dead right now!
I will go through this on the blog this week and if it doesn’t answer your question please get back to me.
x
h
Heather, the call option for QQQ has become expensive like SPY. Is there a lower priced ETF that tracks the NASDAQ-100 that would work with the ITM strategy?
Thank you,
Randy
HI Randy
there are substitutes – but the problem is that they are very thinly traded which means that the spreads are huge.
But I get that QQQ is getting very expensive.
Let me do some investigating and I will do the next blog post on variations to ITM – or the one after if there is anything more pressing!
x
h
Another question please. The SPYG price today is around $109. Why is the lowest strike price available only $94? I have “ALL” selected in the filter and a Dec 18 expiration. How do I get to 60% of the SPYG price?
Thank you,
Randy
HI Randy – I just about had a heart attack when i read this!
But have just checked – there are:
DEc 18. 2026: $75 strike – yes, that is ony a 68% strike
Sep 18 2026: $60 strike – that is 54% strike – only 5 months away, but still within the parameters.
September also has $65, $70 and $75 options.
I can see these on Schwab – what broker are you using?
Pls let me know.
x
h
I’m twitchy as well. We have gone up too far too fast with low volume. I’ve expected a pullback already but still marching higher. I’m going in hybrid. 1/3 now and wait for the “inevitable” pullback. It may just consolidate sideways for a few days as well? And I can add then too on a breakout.
HI Jamie – yes, it is pretty uncomfortable at the moment.
The Iran headlines all seem to be good which is bouying the market – but the speed of the recovery and the low volumes are sending off alarm bells.
But – a system is a system – and there is no law aainst getting into positions bit by bit.
x
h
Also a double purchase here. Both the kindle version and paperback version for my son to read. Review on it’s way.
Thanak you Thor! Much appreciated!
x
h
Same here. I bought both the Kindle and paperback versions. Heather, you’ve truly changed the way I invest, and I’m incredibly grateful for the impact you’ve made.
Denis – what a lovely comment – it has absolutely made my day!
Thank you!
x
h
Hi Heather, I should me more clearer in my communication. In Tradingview I couldn’t see your in-signal at the time I read your new blog article . I used the unadjusted SPY with a 200 and 10 MA and the difference between the two was only 1,34 % yesterday. Now, with the opening of the stock market the chart in Tradingview shows the 1.5 % white space (maybe it’s a time issue with Tradingview).
Thank’s for your fast replay.
Rudolf
Hi Rudolf
I’ve just been looking at the trading view charts (I use OptionGear for all my charting – but it is $50 per month, so the TV charts on the ITM website are not what I am looking at every day)
If you go to here: https://heathercullen.com/stock-charts/ then you will see all the instructions about how to set up the charts for ITM.
Make the candles wide by using your mouse wheel.
Change the cursor to crosshairs (Alt-C) so that you can read off the values.
You will notice that the cursor snaps to the mid point of the candle and you can read the value of the SMA.
On Tuesday 14 the values were 665.38 / 669.79 (approximately, I am reading them off a chart) which is 0.6% apart. This is not enough for the required 1.5% white space so the IN signal was not triggered.
On Wednesday 15 the values were 665.43 / 674 which was white space of 1.4%, close to our 1.5% cut off.
The Optiongear chart I use had slightly different values (presumably because the plots are different and unlike Tradingview it does not default to the centre of the candle) and had reached the 1.5% gap hence the extra blog post.
The signal after close on Wednesday meant that if we decided to follow the signal the we entered the market at open on Thursday.
Thursday was an upday (albeit with a doji candle) which has definitely confirmed the IT signal.
Remember that we use closing prices for all SMAs not intraday prices.
Hope this helps
X
h
Hi,
This is what i have in TradingView for SPY on the 14th thru 16th
Important note: I have “Adjust data for dividends” turned off, makes a significant difference, also note TV does not include ETH in the daily chart
date , close , SMA 200 , SMA 10 , Abs SMA Diff % of Close
2026-04-16 , 701.66 , 666.01 , 679.15 , 1.87
2026-04-15 , 699.94 , 665.59 , 674.51 , 1.27
2026-04-14 , 694.46 , 665.17 , 669.55 , 0.63
I have the diff % calculated as follows: ( (abs ( SMA 10 – SMA 200) ) / close) * 100
Hi Kevin, the backtesting was all based on actual calculated figures – the Blog posts have been based on reading from a chart.
When backtesting I didn’t check anything nder 1 decimal place – so nothing between 1.4% / 1.5% / 1.6%. And 1.5% peprformed the best, so really it was 1.45% – 1.55%.
Reading from a chart , as you know, depends on the chart and I use HUB OptionsGear. I was as accurate as I could be and it was also obvious from the trajectory that it would have to be a massive change in price to stop the golden cross form occuring.
It has been super confirmed now – so all is well.
Hope this makes sense
h
I’m surprised by your statement. In Tradingview the in-signal only occurs by using the adjusted SPY chart (and 1.5 % white space). I allways thougt that we use the unadjusted t SPY for proper backtesting. Do I missed something?
Rudolf
HI Rudolf – I’m not sure what you mean – in TradingView?
OK, I have just looked it up, and have never cpntributed to it.
None of the stuff is contributed by me, all written by a third person, and not authorised by me.
ONly this website and my books have been authorized by me.
Hope this helps
h
Thank you Heather. This blog post answers all my questions. Received your new book yesterday. Started reading it and it is terrific. I will definitely give it a glowing review.
Andy C.
Thank hyou Andy!
x
h
Murphy’s Law is hard at work this week!
You are the best in the financial realm Heather; appreciate your knowledge and instruction. I have purchased both hardcover and paperback and will leave a review.
Thanks as always,
Roger
Thank you Roger!
x
h