


Choosing Options.
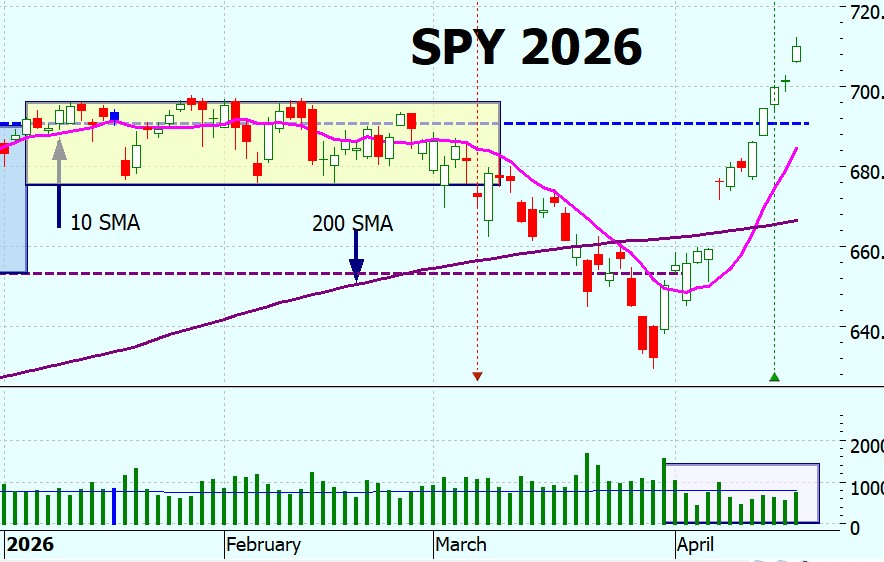
Three golden crosses – these bulls are pretty excited. An 11% rise in 13 trading days (open 31 Mar: $639; close 17 Apr: $710). That’s a fast bull run if ever I saw one.
As I said last week, it makes me twitchy. Not “regression to the mean” – that’s a statistical concept, not a market rule, and it’s routinely misapplied in market commentary. Just an observation: when price moves up this quickly, it often gives a chunk of it back just as fast.

SPY Chart
You can see that the golden cross is well and truly confirmed – and SPY has powered through the 700 mark that acted as resistance for many months before the dip. It looks great – but check the volume. There’s still not much conviction behind the move, which makes it vulnerable to shocks.
Stability & Volatility
My read is that the institutional players are still largely on the sidelines – and the day traders and bottom feeders are having a field day. That is worrying because Institutions tend to be more stable (except at quadruple witching end of quarter). Day traders are far quicker to hit the sell button at the first hint of bad news.

Options Nuts & Bolts
This week I thought I would go through options selection using real time data. I am doing this while the market is closed so that the prices are stable while I am reading them, but obviously as soon as the market opens the prices, bids and asks, will not be exactly the same.
SPY Options
However, an IN signal is an IN signal: so what should we buy? Looking at the options chain, we see that there are September and December options, but none for October and November.
This is normal; the chain isn’t complete by design, months get added as time rolls forward. October 2026 will likely appear in May-July, and November in June – August.
Quarterly cycles ( Mar, Jun, Sep, Dec) are prioritized, that’s why you see them throughout 2027 and Jan / Jun / Dec right out to 2028. But let’s see what options fit our criteria in September and December 2026.
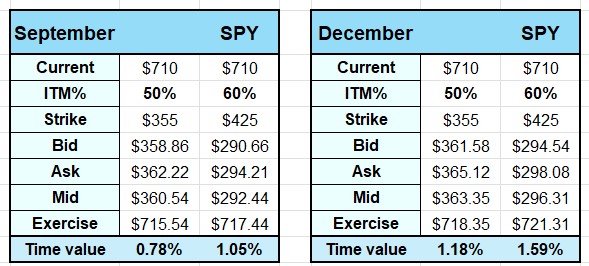
The September options fit nicely into our criteria, the 50% December is slightly over. If we had wanted to choose a 6 month option it would have been the October options which would be well within the time value we are looking for.
Am I saying ‘run out and buy these options’? NO. I am merely pointing out which options fit into our ITM Strategy.
SPYG Options
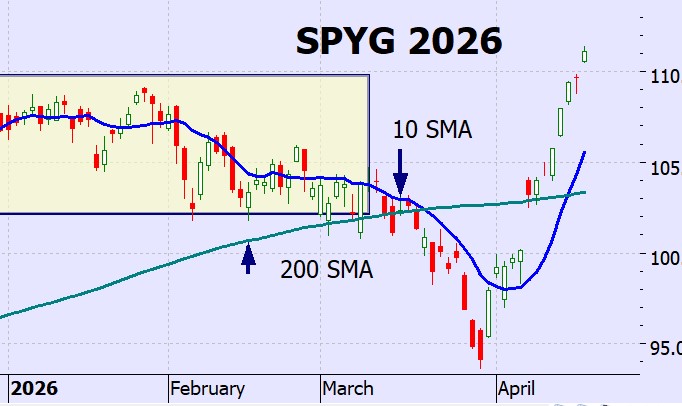
Like SPY, SPYG is now making new highs. At the bottom of the dip it was $94. On Friday it closed at $111. An 18% increase! In 13 trading days! That is enormous.
However, let’s see if we can find options to fit. The first problem is getting the right strikes. For September the lowest strike we can get is $60, for December it is $75. That is the problem with lesser traded ETFs – they do not have the range of the large ones like SPY and QQQ, so we will just have to make do with what we can get.
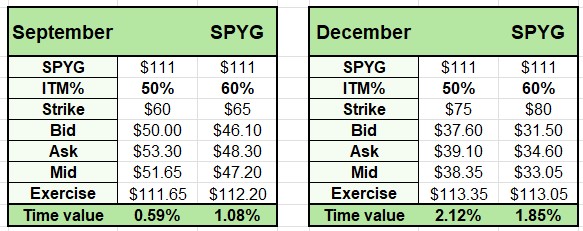
For the September expiry we can get 54% and 59% strikes, and for both the time value is very low, well within our parameters. For December the strikes are 68% and 72%, which are too high, but it is worth noting that the time value for the $80 strike is only 1.85%. Which to choose? September would be the better choice, less leverage and so less risk.
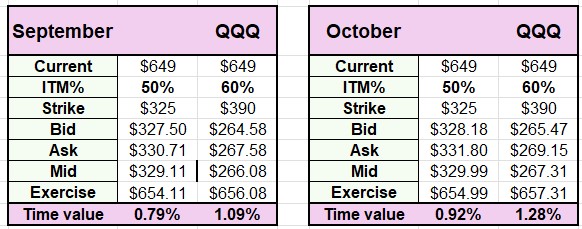
QQQ Options
QQQ has also had a stellar rise (16%) and a golden cross. Crazy. But the market does what the market does. Like SPY we have no problem choosing strikes that fit the strategy, and strangely the QQQ chain has both September and October options.
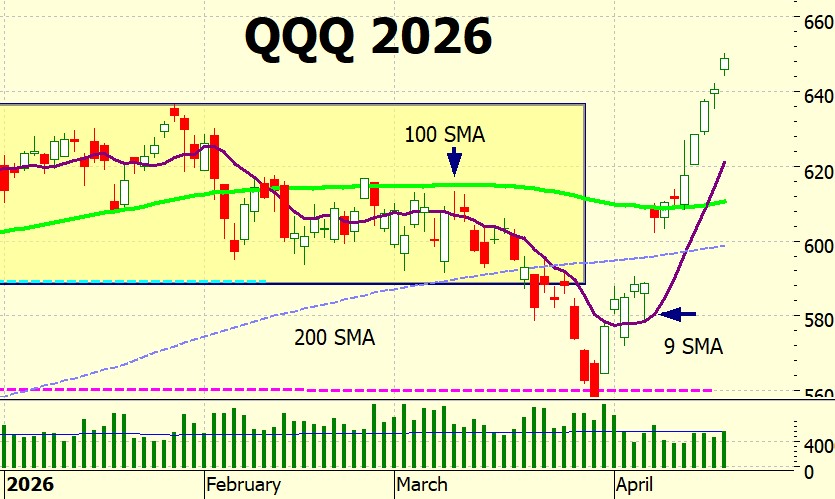
Both September and October options fit our requirements with low time value. And as readers have pointed out, the issue isn’t finding suitable options – it’s the capital required to trade them. We’ll come to that shortly.
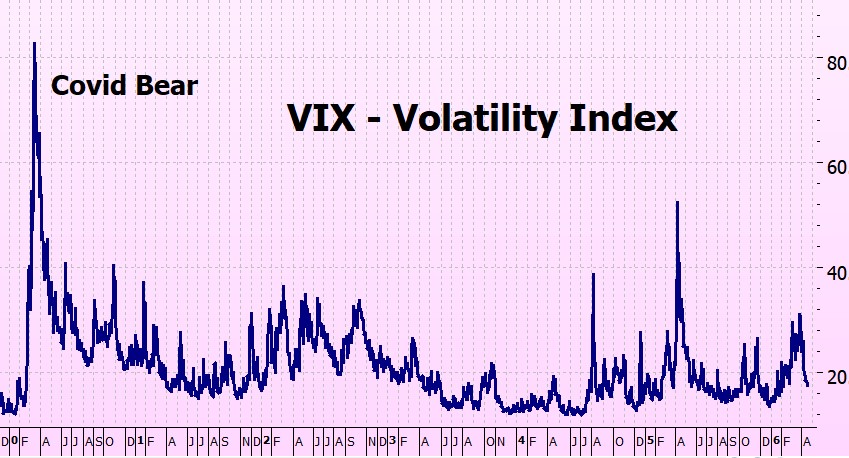
VIX Chart (Volatility)
The VIX is back in low volatility territory – but for how long?
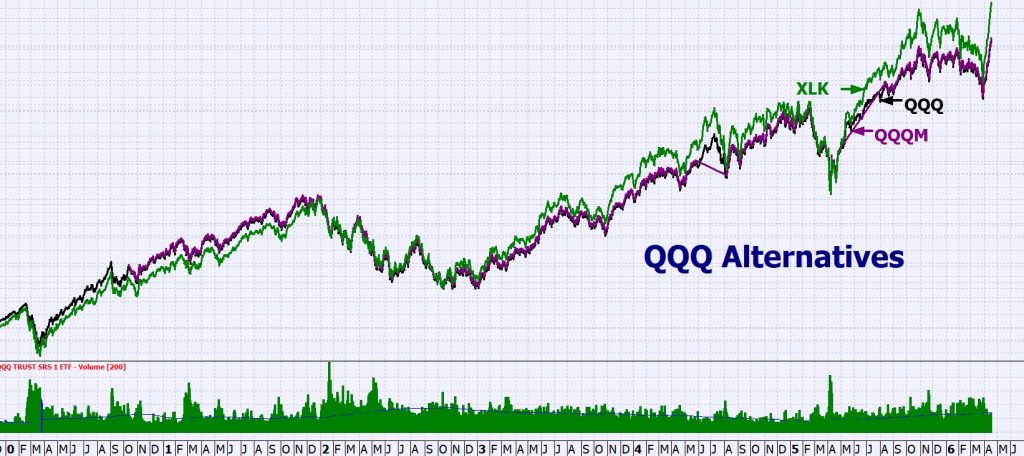
Alternatives to QQQ
I have had several queries about a cheaper alternative to QQQ. There is no direct low-cost equivalent to QQQ with a proper options market. But two partial alternatives are:
- QQQM
- $267 approx.
- Market cap: $30–50B
- Same index as QQQ, lower price and fees. BUT options market is thin → spreads wider, limited strikes.
- XLK
- $150 approx.
- Market cap: $60B+
- S&P tech sector. Lower price → cheaper contracts. Very concentrated (Apple/Microsoft heavy). Decent options liquidity.
Comparative Charts
You can see that for the last 6 years they track QQQ rather well.
QQQM & XLK Options Chains
- QQQM
- Expiry – Good, out to Dec 2028
- Strikes – Not bad -Sep starts at $135 (50%), Dec at $170 (64%)
- Spreads – Acceptable (but wider than QQQ), bid/ask Sep $135 is 132.40/135.40
- Liquidity – Not good, OI very low so reliant on market makers.
- Capital requirement: $13k for 50% option.
- XLK
- Expiry – Good, out to Jan 2028
- Strikes – Not bad, Sep starts at $67 (44%), Dec is very low at $45 (30%)
- Spreads – not bad, bid/ask Sep $75 is 78.50 /82.45
- Liquidity – not too bad, some OI
- Capital requirement: $8k for 50% option.
QQQM & XLK Options Chains
These both look promising but I have not backtested them. Right at the moment I would rather eat my own head than do any more backtesting. I even dream about it! I need a break from it – but you all know the strategy – maybe someone wants to do the backtesting and share it with us? (gentle hint)

Why do we analyse charts?
If the IN and OUT signals are clearly defined surely that’s all we have to watch?
Yes, that is true – but don’t you always want to understand what’s going on? I know we can’t affect the markets, but it isn’t it good being able to figure out what is moving them?
It’s like being in a plane. Obviously, I have no control over how it flies, but I am still glued to the flight path and the window. I want to know exactly where we are and where we are going – but maybe that’s just me!
ITMeter

The week ahead
Likely to be dominated by the news cycle, but here is what else is happening:
Monday – April 20
• Leading Economic Indicators.
• Earnings: none major.
Tuesday – April 21
• No major U.S. economic releases.
• Earnings: Tesla, Lockheed Martin.
Wednesday – April 22
• No major U.S. economic releases.
• Earnings: IBM, AT&T.
Thursday – April 23
• Initial Jobless Claims, Durable Goods Orders.
• Earnings: Intel, PepsiCo.
Friday – April 24
• No major U.S. economic releases.
• Earnings: American Express, AbbVie.
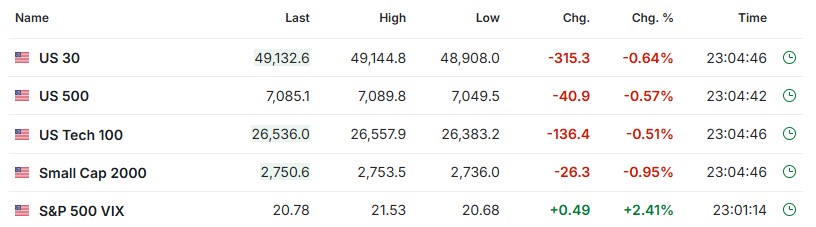
The futures . .
Down a bit – but not as much as I expected given the news about Hormus being closed again. Notice the VIX is up a bit.
The Biggest Thank You Ever . .

. to those wonderful readers who have given me such lovely reviews.
I am genuinely moved and humbled by your generosity, and so very glad that I have helped in some way. x h
Fingers crossed for a good week!
Heather
Trade the tide not the waves
Q & A
P.S. no podcast this week – I didn’t think this blog was suited to one – too many figures and tables.


17 Responses
An FYI. When I tried to enter a buy on SPYG I got a message from my broker (TastyTrade) that trading for that symbol had been set to closing orders only. I asked for specifics and got the following: “As a firm, we have seen a number of low priced, illiquid symbols used for fraud. The exchanges have been unwilling to work with us to combat this, so in order to protect our customers as well as the firm, we have set all trading on these symbols to closing only transactions until further notice.”
Hi Jay – thank you for letting me know this – probably others are having the same problem.
To reassure you – this is a broker problem not a problem with SPYG itself.
It will take too long to explain here in the comments, so I will write this week’s blog on it which will (hopefully) answer your questions and explain how to manage the situation.
x
h
TastyTrade’s answer to my enquiry included an offer to allow me to open SPYG positions, which I accepted. I stayed on the phone line for a couple of minutes and was told I could now open such positions. My broker was willing to do so on a one-by-one basis if requested but wanted acknowledgement of the situation. So not hopeless, but at least with TastyTrade you have to ask and agree.
No need to reply, Heather, and thanks. And I’m loving your new book.
Heather,
I just got my new book, love it. I made sure to leave a review.
Could you please confirm the “official” reentry price on SPY for me. It looks like the golden cross happened around 670ish. However, given that the move was sharp, I think it we were not able to enter before 700?
Thanks
Ruben
HI Ruben
Glad you are liking the book – and thank you for the review!
Re entry point: on 15th April the 10 SMA was $677.02, the 200 SMA was 665.83, giving a gap of 1.68%, over our 1.5% threshold, so we entered at open the next day at 701.06.
I am reading the figures off the chart, so they may look slightly different on your chart, but it was definitely over 1.5% and there was even more confirmation on the 17th.
Today didn’t looks quite so good, hoping it is just a pause for breath not a reversal – but we will see.
Hope this helps
X
h
Thank you Heather! I’ve been using XSP and XND. They’re options based on the index so they settle European style (no early assignment – not that that matters in the case of ITM). They also get favorable tax treatment in the USA on a mark to market basis (taxed 60% long term, 40% short term no matter when they are sold). Liquidity and spreads seem good to me. I’m not sure if they are available outside the US.
HI Michael
Hi — that’s an interesting approach, thank you for sharing it.
XSP and XND aren’t standard ETF options like SPY and QQQ — and they don’t always show up in the usual symbol searches. They also aren’t cheaper in any meaningful sense; the contract size is roughly the same as SPY/QQQ, so the capital required is similar.
Where they do have an advantage is tax treatment (in the US), with the 60/40 split, which can make them attractive for some traders. Those of us outside the US generally don’t benefit from that, and I’ll happily leave tax to the experts.
For the ITM strategy the key issue is execution. SPY and QQQ have much tighter spreads, deeper strike ranges, and more reliable fills — especially deep ITM, where it really matters. XSP/XND can work, but they tend to require more patience and negotiation on pricing, which adds friction.
So while they’re structurally interesting, we stick with SPY and QQQ because they are simply cleaner and more consistent to trade.
But thank you for bringing it to our attention — other US traders may be very interested and want to explore it further.
x
h
Thank you for the “what should we buy charts”! I bought your book last week and just started reading. I’m impatient and was searching for these in the early part of your book. I’m primarily a cash secured put seller on stocks like AAPL, AMZN, etc., but looking for a change. As I was reading, I kept thinking about the few LEAP trades I’ve done at lows for a stock. They were easy. Buy the 80 delta ITM call as far out as you can go in expiry. Then sell covered calls on them. Cost basis is price paid for the call plus the strike. I still have many pages left in your book, but I’m guessing since I’m not good at technical analysis, LEAPs are easier for someone like me. Your strategy is giving the “IN”, but LEAPs are not due to being at market highs. I look forward to finishing your book and will give it a review. I’m sure I’ll learn a lot. Thank you!
Hi Jeanette,
Nice to hear from you, and yes, I would appreciate a review – only it you like the book, of course!
Re using LEAPS – they re not really suitable for the ITM strategy as part of its performance is rolling up to make sure that we stay at a constant leverage (50% or 60% depending on which you choose). When it dips too much below we roll up – which can mean in a trending market we may be rolling up every few months – or even less if it is strongly trending.
That kind of negates the advantage the you get by having LEAPS that you plan on having for the long term.
Selling covered calls against LEAPS is a legitimate strategy, but with ITM you get more leverage – hence the outperformance.
If this doesn’t make sense please get back to me!
x
h
I have been using SPYM as a proxy for spy. It has similar options to SPYG and I can usually get my orders filled within your 2% range for a 60% ITM option. I use Walk Limit orders on Schwab and they usually get filled at mid point or slightly below.
Love your new book, have purchased 3 copies for gifts and one for myself.
Thank you so much for the unselfish giving of yourself to do your weekly blog and helping all your followers like myself to understand the market better,
Jim
Hi Jim — I’m glad you like the new book, and thank you for your very kind words!
I’ve just had a look at SPYM and you’re right — the chart has been tracking SPY very closely in recent times.
SPYM is a momentum ETF, so it selects stocks with the strongest recent price trends and rebalances regularly. That means the holdings change over time — it rotates into whatever is currently leading, and its performance depends on those leaders continuing.
Recently that has largely meant tech and AI, which explains the strong performance. The question is what happens when leadership shifts – that’s where it can behave differently from SPY.
I haven’t backtested it, but it’s very useful to hear that you’re getting fills within the 2% range on 60% ITM – that’s the key practical test. Well done. Keep us posted.
x
h
I think you have SPYM confused with another ETF. State Street says it tracks the S$P 500 index and holds all 500 stocks. When I put it on a chart with SPY you can’t tell them apart. There is a momentum ETF that I have shares in, SPMO, but its options aren’t very good and pricey. It has outperformed SPY in almost any timeframe you can chose over it’s 11 year history so I keep some money in it.
Please take another look at SPYM and let me know if I am wrong.
Hi Jim thank you for this, I had another look.
You’re right that SPYM tracks the S&P 500 and holds all 500 stocks, so structurally it is very similar to SPY. That explains why the charts sit almost on top of each other – in normal market conditions you wouldn’t expect to see much difference.
Where it can differ is in the weighting. SPYM applies a momentum tilt, so although it holds all 500 stocks, the weightings shift toward the stronger performers. In a market like the current one, where leadership has been quite concentrated, that can make it look almost identical to SPY.
For the ITM strategy, the main question isn’t the chart but the options chain – strike range, spreads, and reliable fills. If you’re consistently getting fills within the 2% range, that’s the key test, and it sounds like you are, which is great.
I haven’t backtested SPYM, so I can’t comment on how it behaves across different cycles, but it’s certainly useful to have it on the radar.
And yes, SPMO is the more “pure” momentum version – but as you say, the options aren’t really workable.
Please keep us posted – very helpful. I’m always learning from these comments!
x
h
Hi Heather!
I notice that you mentioned there is a spy bull and bear signal in your new book, but for qqq, there is only a bull. That being the case, wouldn’t it work better to just use the spy signals for both the bull and bear on qqq?
I’m not sure if that has been tested, but the markets correlate so much with each other anyway, so it seems like that would work, but the gains and losses would just be larger since QQQ is more volatile.
Thanks!
Hi Brian, yes, that is right I have only tested the bear strategy on SPY.
I would be very twitchy about doing bear trades on QQQ as it is more volatile, and not on SPYG as bear trades are more risky than bull trades so for those traders with small accounts it is probably best to sit out the bears rather than try to trade them.
I may look at a QQQ bear strategy soon – but right now I need a rest from backtesting!
x
h
Love the new book and the new ITMeter! Thanks for your blog too. Big relief to find a good system!
HI Brett – thank you!
x
h