


When Your Broker Becomes The Risk
There have been reports from some traders that TastyTrade has set SPYG to closing only – in other words, you can sell any positions you have, but you can’t open any new ones. Their explanation: low priced, illiquid symbols used for fraud.
Breathe. This looks alarming – but it isn’t.

Is SPYG Safe?
SPYG isn’t the problem. There is no exchange halt, or regulatory issue. If it was then you would see the restrictions across ALL brokers, and there would be news about it and exchange notices. None of that is happening.
This is a broker-level restriction.
So Why The Restrictions?
SPYG is a perfectly legitimate ETF, but with lower liquidity than SPY This means the options market is thinner and the bid-ask spreads are wider – something we already know and deal with as traders.
But for the broker? It makes it harder for them to manage risk on client positions.
Types of Brokers

All brokers look the same – but they aren’t. Let me explain. There are (broadly) two types:
Tier 1 – these brokers manage risk internally. They have deep liquidity access, can hedge client exposure and rarely need to restrict client trading. Examples are IB (Interactive Brokers), Charles Schwab and Fidelity Investments.
Tier 2 – these brokers manage risk by restricting clients. They rely more on external liquidity and have tighter internal limits. They respond to internal stress by switching symbols to closing only.
The Real Issue: Tier 2 Brokers
Platforms like Robinhood (and to a lesser extent tastytrade) are built around high-frequency retail activity, not long-term, capital-intensive trading.
Their model is optimised for engagement: low barriers to entry, simple interfaces, rapid trade execution, and a steady flow of short-term trades.
They naturally attract day traders and smaller accounts, so these platforms rely more heavily on external market makers and tighter internal risk limits
The Risk for ITM Traders
When conditions become difficult – wider spreads, thinner liquidity, or unusual options activity – these brokers are quicker to restrict trading. For a day trader placing small, frequent trades, that may be an acceptable compromise.
A strategy like ITM depends on consistent access, defined entry points, and the ability to act without interruption. So these brokers introduce an additional layer of risk that has nothing to do with the market itself.
Extra Risk

The broker becomes part of the risk you have to manage. Once you’re in, you don’t control everything. It’s not just price, timing and execution – it is whether you are allowed to trade at all. And that’s a serious risk.
The ITM Takeaway
This isn’t about recommending one broker over another – you know that I am open about the brokers I use, and have used. I am not affiliated with them in any way – no kickbacks or commissions.
But it is important to understand this: when volatility rises some brokers keep markets open – and others close them. If your strategy depends on being able to act when signals appear, that distinction matters.
So SPYG is Safe?
Yes. This is not a market event – it’s a broker decision. The ITM strategy assumes the market may not cooperate. It should not also have to assume the broker won’t.
ITM BLOG Audio & Video
This written blog is a high-level summary and this week it probably doesn’t go into the subject deeply enough. For more information:
- Listen to the audio – it goes into more detail about brokers (but ignore the delta hedge bit, AI had the bit between its teeth!)
- For how to check your broker watch the video
To the markets . .
Another relatively positive week. The markets seem to be shrugging off the middle east situation and having a nice bull outing.
SPY Charts
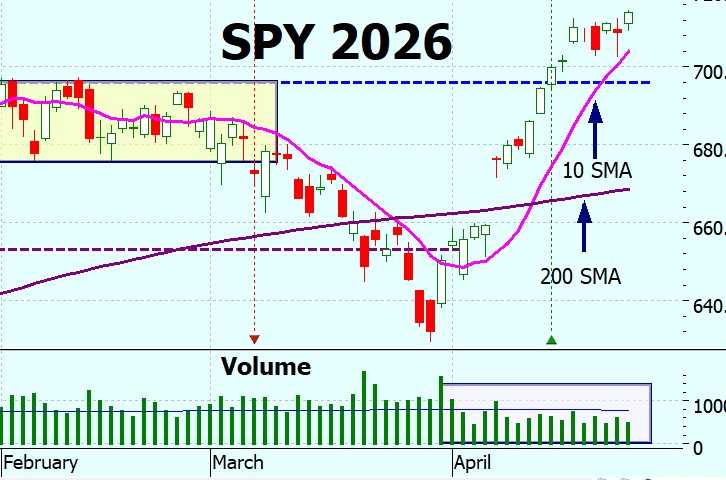
SPY making new highs this week. It didn’t even pause at the 700 level (although I thought that might prove significant) – it just powered straight through it. Despite making new highs they were quite subdued; until Friday it was more of a consolidation pattern.
The thing that still concerns me is the lack of volume – below average for all but one day in April. And on a 13% rise! I am starting to think I am just a worry-wart, but it would be normal market behavior to at least retest the previous high (blue dashed line). But the market does what the market does – it doesn’t care what I think!
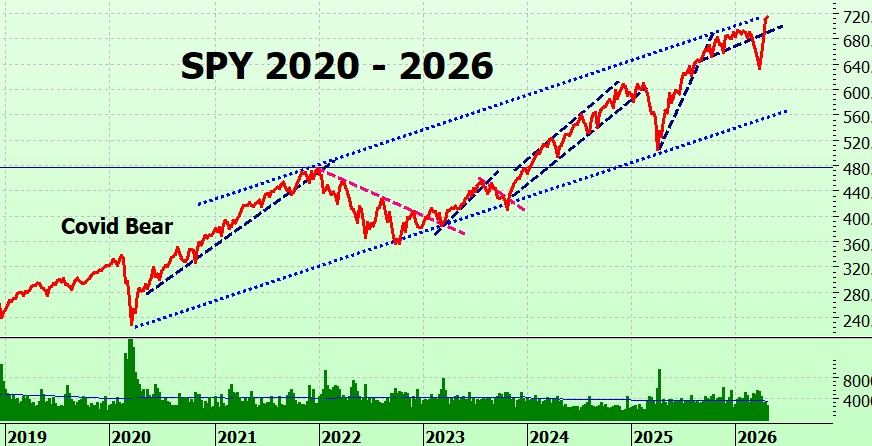
The weekly chart shows SPY at the top bound of the long term trading channel – and at the top bound of the 2025-6 trading channel.
Actually, that chart gave me pause – so I went back to the daily chart and added the MACD. Now, as we know some indicators work some of the time – but we never know when. I wanted to see if the MACD was showing divergence – and it is (although it is early days).
See the red dashed arrows: price going up but the MACD histogram going down.
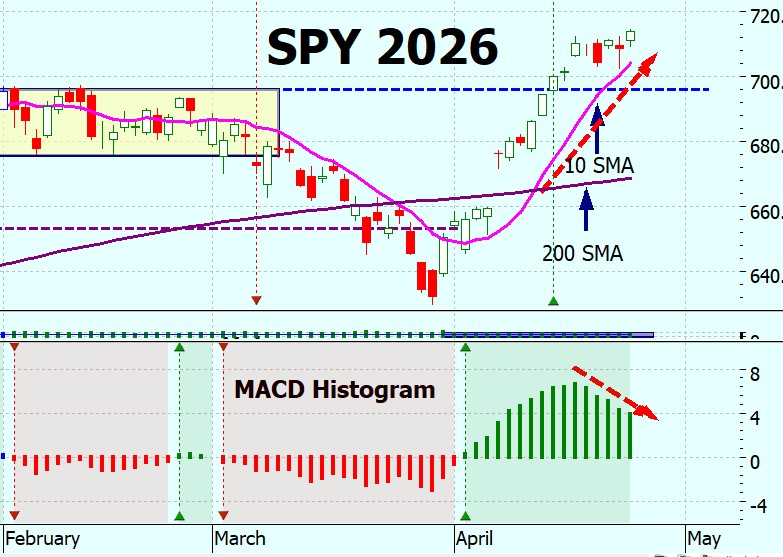
The price is still pushing higher, but momentum is starting to fade. The MACD histogram is rolling over rather than confirming the move, suggesting the rally is losing strength. It’s an early warning rather than a confirmed divergence, but it does leave the market more vulnerable to a pullback.
Just to be clear: we don’t act on the MACD but it is useful in helping us understand what the market is doing.
SPYG Charts
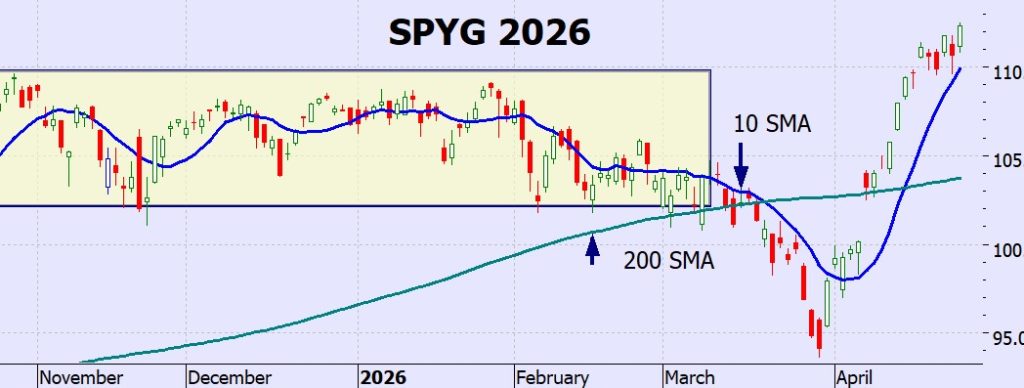
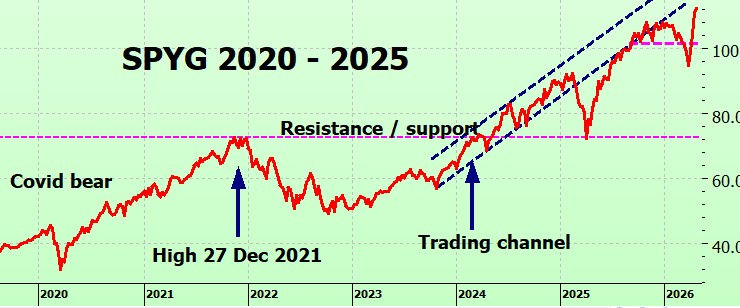
SPYG also making new highs, and a whopping 19% rise since it bottomed. My guess – and it is only a guess – is that traders may start taking profits around the 20% mark. This will only affect SPYG, however, not the market as a whole.
Longer term you can see the precipitous rise in context. A bit like the rise we saw after the ‘Tariff Tantrum’ last year.
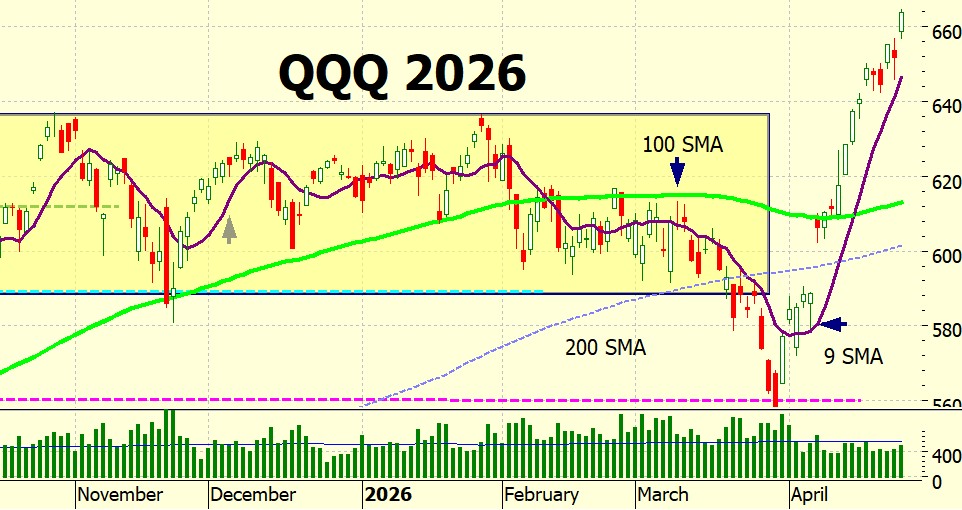
QQQ Charts
QQQ has also had a sharp rise – also 19% from the bottom. If traders decide to take profits at 20% (and traders do like round numbers) then that could have a broader impact on the market.
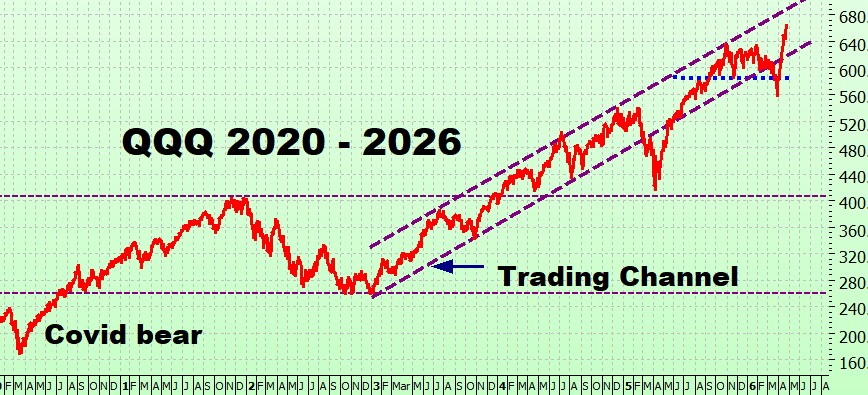
Note how similar the chart is to the SPYG chart – this is because SPYG holds the S&P 500 ‘growth’ stocks and many of which are large technology stocks – so it tends to align more closely with QQQ than SPY.
Longer term, we see it is back in the trading channel.
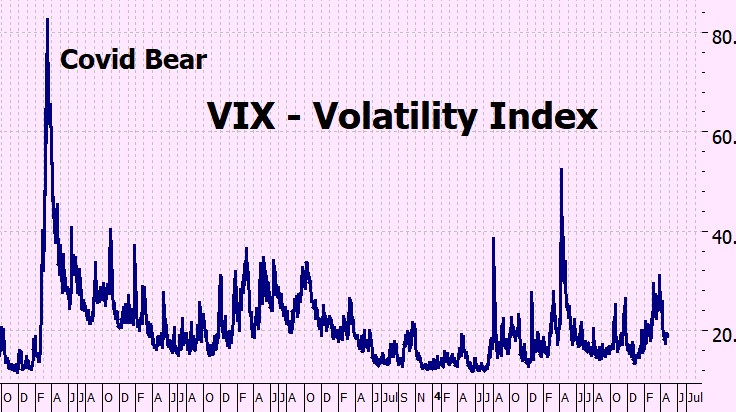
VIX Chart (Volatility)
The VIX is back in low volatility territory.
ITMeter

The week ahead
Again, it is likely to be dominated by the news cycle – but I think everyone is getting used to it, it is the ‘new normal’. Six big tech earnings this week – that’s going to be interesting!
Here’s what else is happening:
Monday – April 27
• No major U.S. economic releases.
• Earnings: Domino’s Pizza, Cadence Design Systems.
Tuesday – April 28
• Consumer Confidence Index, JOLTS Job Openings.
• Earnings: Microsoft, Visa.
Wednesday – April 29
• GDP (Advance Q1), Pending Home Sales.
• Earnings: Meta Platforms, Qualcomm.
Thursday – April 30
• Initial Jobless Claims, Core PCE Price Index.
• Earnings: Amazon, Apple.
Friday – May 1
• Non-Farm Payrolls, Unemployment Rate, ISM Manufacturing PMI.
• Earnings: ExxonMobil, Chevron.
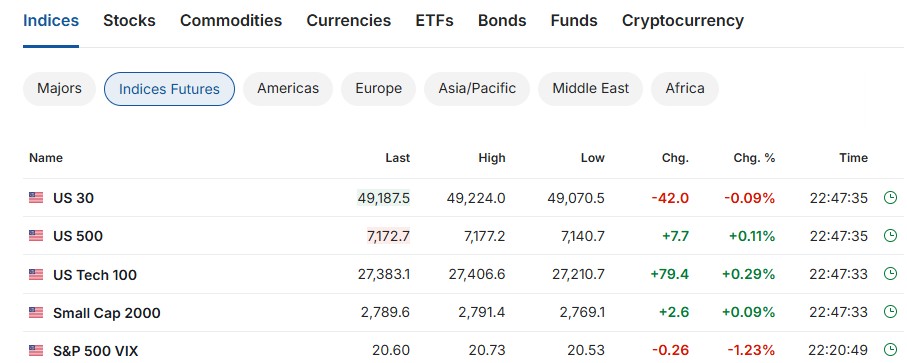
The Futures . . .
. . .don’t seem to be much phased by the events at the Correspondent’s Dinner.
GoodReads & Reviews
Thank you for all the lovely reviews – I am truly grateful!
If you’ve read the book and it’s working for you, a quick Goodreads rating helps other traders find it—feel free to copy your Amazon review across!
- Leave a Review: Click this link: GoodReads then scroll just below the cover to hit the stars and ‘Write a Review’.
- Vote for the Book: While you are there, please go to the Best Options Trading Books click on ‘Add books to this list’ then search for In The Money: Bull and Bear Markets and click ‘Vote for this book’.
It helps other traders find the strategy. Thank you so much!
Fingers crossed for a good week
Heather
Trade the tide not the waves


16 Responses
Heather, I am about half way through your book. Everything that I have read so far has been extremely interesting and informative. I look forward to the rest. Your ITM Blog is outstanding as well and I would appreciate being added to the weekly and special updates. Like some of your other followers, I am planning on implementing your ITM strategy using the lower cost SPYM options. Thanks so much!
Hi William – thank you for your kind words!
Glad it was helpful.
x
h
Thanks, Heather. Very helpful information.
Try spym and qqqm options
Please try with QQQM and SPYM, not so liquid as SPY or QQQ, but better than SPYG
HI Julieta – I have had a look at both QQQM and SPYM – both are (comparatively) recent. QQQM in 2020, SPYM in 2024. SPYM was launched specifically as a lower cost ‘companion’ to SPY, snd effectively it performs the same.
Both have expiry dates going well into the future (good) and a decent choice of strikes.
The only problem is liquidity – which translates into wider spreads, which can also widen during periods of volatility – say, a market sell off where you may have to contend with slippage.
However, given that we are not daytraders jumping in and out of positions this should not affect us too much – so I would say they seem like good low-cost alternatives.
Thank uyou for the ‘heads up’.
x
h
Very interesting! I love your book!
Thank you Veio!
x
h
Hi Heather, I read your book In the Money Bull Market and really enjoyed it. I was interested at looking at the back testing data but wasn’t able to find it on your website. Would you mind pointing me in the right direction? Thanks, Peter
HI Peter – the link is on the footer of all the pages – but here is a link: https://heathercullen.com/backtesting/
x
h
Hi, that’s a very interesting strategy. I’ve been trading options for about 10 years now and have managed to multiply my account balance, so now I’d like to take things a bit easier. Is it possible to get your books in PDF format? I’ll need to have them translated because my English isn’t perfect. It doesn’t work very well with the Amazon Kindle. Thank you very much Best regards, Florian
HI Florian,
Unfortunately, Amazon doesn’t let me sell the books anywhere except on their website and in their formats for 90 days after publication. I have sent you an email outlining possibilities.
x
h
I am wondering if some of the volume is people holding off in anticipation of the IPOs coming..So so many huge IPOs rumored. Spacex , OPEN AI, Anthropic. The dollars have to come from somewhere. Traditionally, a lot would come from the Middle East – but it is also rumored that just about every government there is asking for swap lines from the US Fed/treasury. They combined values is something around $3-4 Trillion!! That is a lot of cash, if they get added to the S&P 500 every fund is going to be planning how to get some. The companies leaving the index, oh my, that will hurt.
Hey Kate – could be, I hadn’t thought of that.
I’ll have to brush up on IPOs.
Thank you for the heads up.
x
h
Pretty pictures of where the market used to be…Gaps • momentum • volume… We all have our favorites. Maybe the smart money is waiting to see how the blockade is going to work out. Maybe the Military – Industrial Complex is waiting to see how their new weapons’ gadget is going to work out. Let’s see how the Lawsuit between Musk and Altman works out! You’re not the only worrywart. Great book • Great blog • Great Audio … uh oh too many greats…
R
Thank you Randy!
Kate – the comment above (below?) had an idea about the lack of volume, could be that.
But yes, I keep worrying thinking it can
t keep going up – and every day I am proved wrong!
x
h