


Zero Commission Fraud.
Zero commissions seemed like a dream when I started trading many years ago.
I cut my teeth on the ASX (Australia) but quickly realized that it was a loser’s game.
The brokerage on an options trade was $45. So, buying and selling meant $90. Buying and selling a spread was $90 on the way in, $90 on the way out.
And don’t get me started on iron condors – if your average options trade was $1,000 then you had to make a profit of over 36% before you didn’t make a loss.
Ah, the good old days!
Video
Podcast
Is It Better Now?
Sure, we have zero commission trading (just not in Australia). But in the world of professional options trading, we know that when a service appears to be free, you are usually the source of the profit. There’s no free lunch. So how does it really work?

Zero Commissions
Think you’re saving money with zero commissions? Think again. Data from The Journal of Finance (2023) shows that retail options traders are bleeding roughly $5 billion to $10 billion a year through the back door.
By avoiding commissions, you’ve basically invited your broker to take a massive “hidden tax” out of every fill. Between the wide spreads and the wholesalers cherry-picking the best trades, the cost of ‘free’ is actually higher than the old $5 commissions ever were.
The house isn’t just winning; it’s charging you for the privilege of sitting at the table. And the results show up very clearly in the data.
Your Broker is Not Your Friend
Let’s be clear: brokers are there to make money, not to do you favors. Now that ‘zero commission’ has become the industry standard, they’ve simply moved the toll booth.
It’s called PFOF (Payment for Order Flow) – a system where market makers pay your broker a kickback just to handle your trades.
The reality is that they get paid significantly more for options trades than for stocks. The data proves that the market makers paying the biggest kickbacks also offer the worst execution prices. Essentially, your broker is getting rich by selling your trade data to the very person most likely to give you a raw deal.

You aren’t the customer; you’re the product. This isn’t just about cost – it’s about behaviour. The system rewards activity, risk, and bad trades
The Big Three Gatekeepers
The big three wholesalers – Citadel Securities, Susquehanna (G1 Execution Services), and Virtu Financial – essentially act as gatekeepers, handling 90% of all retail options traffic.
Because they pay brokers for the right to see retail trades first, they can “internalize” the most profitable orders and only send the “toxic” or difficult orders to the public exchange.
This creates a two-tiered market where the retail investor is consistently trading against a counterparty with a massive data advantage.
That’s a structural conflict of interest
How does the free lunch work?
The data is unambiguous: the average retail options trader isn’t just losing; they are being systematically harvested. Between the “Big Three” wholesalers gatekeeping your orders and the predatory allure of “zero commission” brokers, the system is designed to nudge you toward high-risk, low-probability gambles that line their pockets while shredding yours.

The 90% Club
You’ve probably heard that 70% of traders lose money, but the latest data suggests that’s actually an optimistic estimate. In reality, about 90% of retail options traders end up in the red.
It’s not just bad luck; it’s bad math. Most retail punters are addicted to “lottery ticket” weekly calls with massive 20% spreads. By the time the broker and the wholesaler take their cut, you need a moonshot just to break even.
Between the predatory spreads and the ticking clock of time decay, the ‘free’ trading revolution has mostly just made it easier for the average person to go broke faster.
Persistent Losers
A study in the Journal of Banking & Finance looked at nearly 70,000 real accounts and found that for most retail traders, options are basically a wealth-shredder. On average, these portfolios lose 5% to 9% every single month. The real kicker? Investors don’t get better with practice.

Most people just use options to buy “lottery ticket” calls that almost never pay off. Whether you’re a newbie or a veteran, the data shows that instead of hedging risk, most individuals are just paying a massive “gambler’s tax” to the market.
The High Cost of Performance Envy
When traders see someone else winning, they take more risk. This is exactly what the ‘gamified’ Tier 2 brokers (see last week’s blog) want to encourage, hence the publication of leaderboards, and encouragement of chatrooms.
In chatrooms people rarely boast about their losses, but are far more likely to crow about their triumphs. This makes other traders feel like losers because they are not making these kind of massive profits, and so increase their risk in an effort to emulate another’s ‘success’.

Changing the Game with ITM
The reason 90% of retail traders end up as statistics is that they are buying “hope” in the form of cheap, out-of-the-money lottery tickets. They are fighting the “Big Three” gatekeepers, massive bid-ask spreads, and a ticking clock that they can’t win.
The ITM Antidote
Our In The Money (ITM) strategy is the deliberate antidote to this retail trap. We aren’t chasing moonshots or paying a “gambler’s tax” to wholesalers. We use options that behave much more like the underlying stock itself, providing high exposure to price movement without the low-probability gambling of OTM strikes.
We are focused on rules-based entries that treat options like a professional tool rather than a trip to the casino. The data shows exactly why the “average” trader fails – which is exactly why we don’t trade like the average trader.
The ITM Takeaway
The system isn’t broken. It’s working exactly as designed. The only question is whether you trade with it – or against it. Or step outside the mainstream altogether.
(References listed at bottom of blog)
To the markets . .
Well, I’m going to give up worrying – having expected a reversal for the last 4 weeks I have been proven wrong – and ITM is smugly rubbing it in. That’s why we have rules based trading – no room for opinions (like mine). We do what we know works.
(Last week had several big earnings – covered this later in the blog.)
SPY Charts
Again, SPY is making new highs. The rate of increase has slacked off a bit – recently it has been in more of a consolidation phase – and the volume is still not up to average. The MACD is still showing divergence – but there you go! Indicators are right some of the time – we just don’t know when.
To be fair the MACD shows signs of slowing its downward trajectory – but we don’t trade on the MACD, it is just an indicator we use to help us understand what is going on.
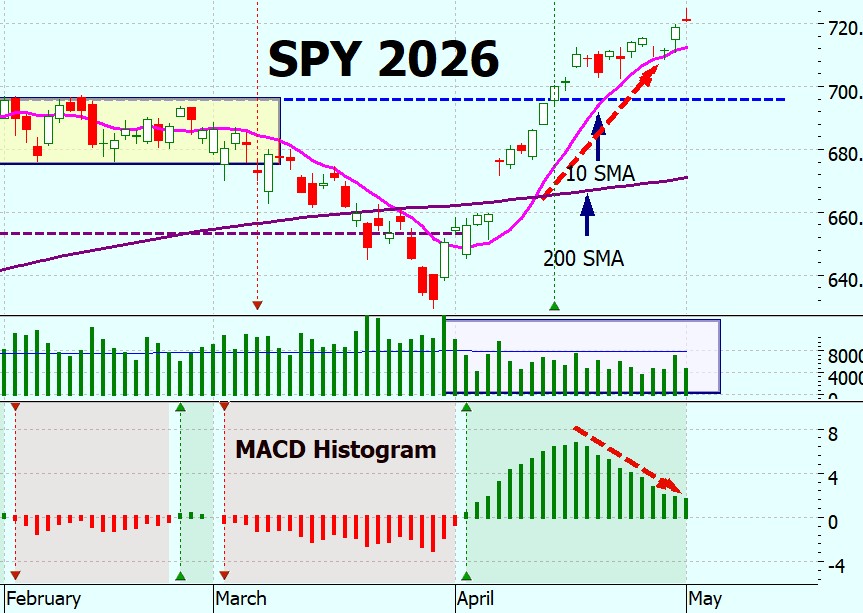
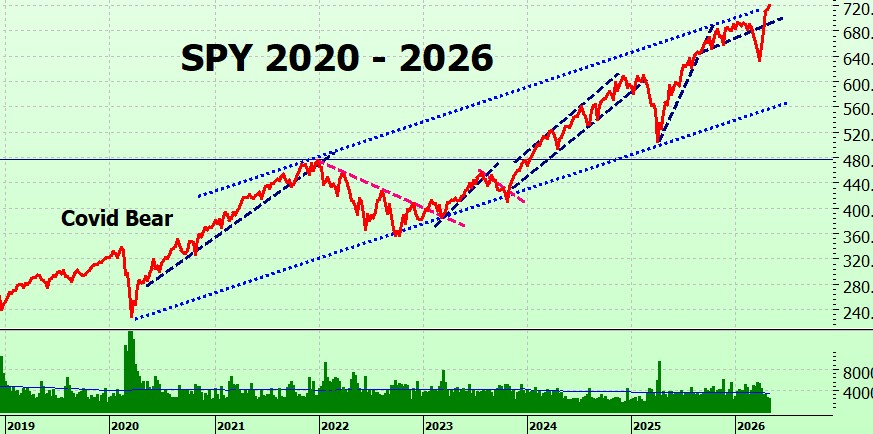
The longer term chart shows SPY piercing the upper bound of the trading channel – normally a bullish sign.
SPYG Charts
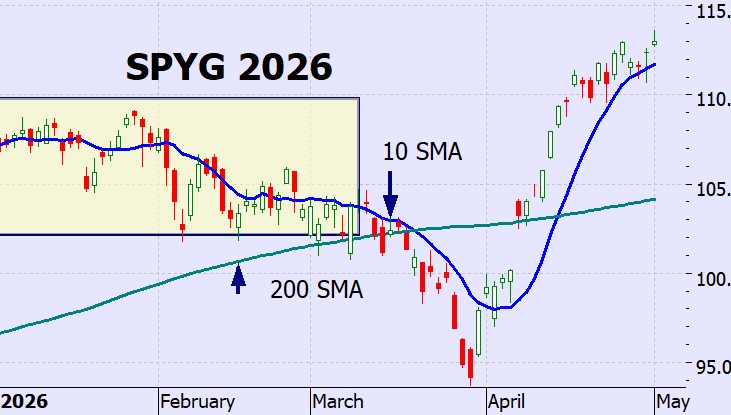
SPYG had a small consolidation period and is now making more highs. A meteoric rise!
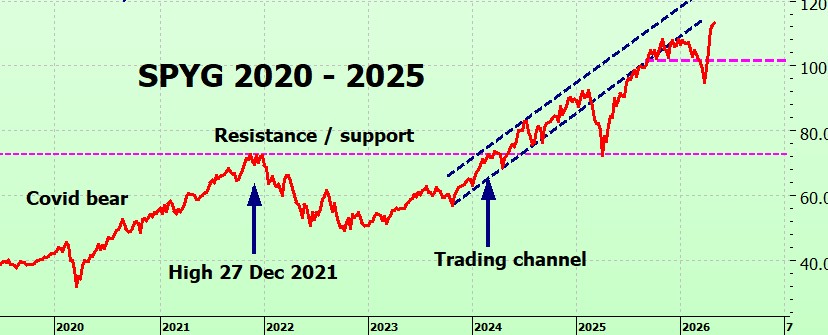
The long term chart shows SPYG nudging the bottom bound of the 2023-2025 trading channel.
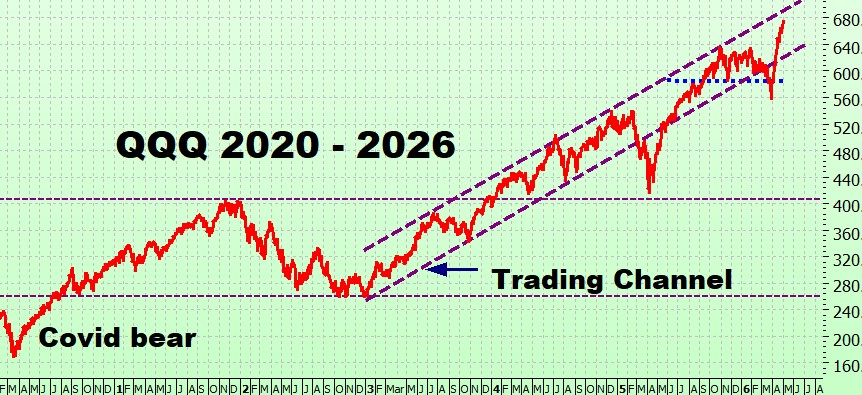
QQQ Charts
A meteoric rise, with not even a pause for consolidation. Straight into the stratosphere, new highs almost every day.
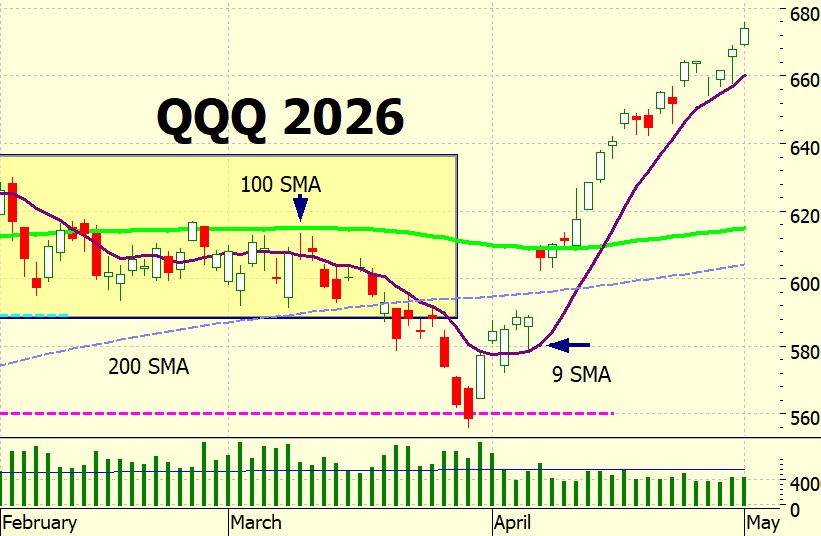
Longer term it is just about hitting the top bound of the trading channel.
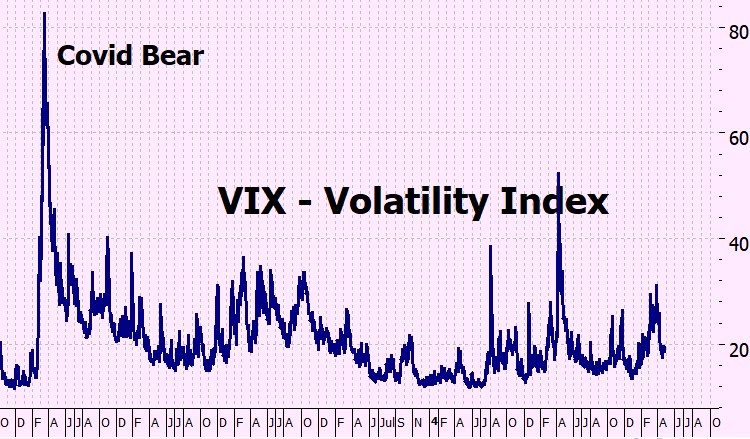
VIX Chart (Volatility)
The VIX has calmed down and is back in low-volatility territory.
ITMeter

The week ahead . .
First, a review of last week and the Big tech earnings which were strong across the board but the real story is the scale of capital expenditure on AI infrastructure, now estimated to be $700B – $1T in 2026. Markets are asking: will AI pay off? Or just consume capital?
AI is driving everything, and capex now seems to matter more than earnings. Several companies beat estimates but were still sold off due to the level of spending. Leadership divergence is beginning to emerge:
- Google currently seen as executing best
- Meta under pressure from spending
- Microsoft/Amazon in the middle.
This week’s announcements and earnings:
Monday – May 4
• Factory Orders
• Earnings: Ford, Palantir
Tuesday – May 5
• Trade Balance
• Earnings: AMD, Super Micro Computer
Wednesday – May 6
• No major U.S. economic releases
• Earnings: Disney, Uber
Thursday – May 7
• Initial Jobless Claims, Productivity
• Earnings: Shopify, ConocoPhillips
Friday – May 8
• No major U.S. economic releases
• Earnings: none major
The tech earnings in there:
- Palantir — growth Vs valuation?
- AMD — direct competitor to Nvidia
- SMCI — is AI server demand holding up?
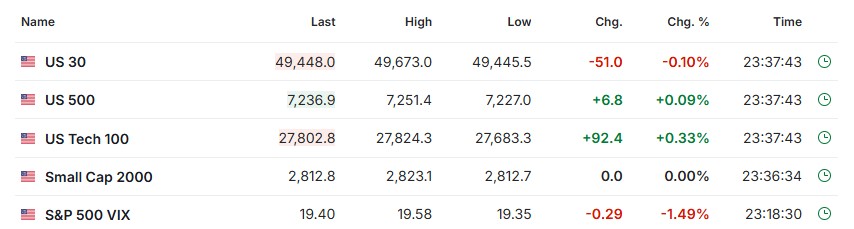
The futures . .
. . marginally positive at this stage.
Video & Podcast
I notice that not may people are watching the videos, which is a shame. Have a look at this week’s video – the diagrams explain the broker process way better than I can in print.
Have a look and see what you think. The podcast is pretty good too.
Book Reviews
Thank you to everyone who has posted a review – I am really grateful. If you liked the book but haven’t already posted a review here’s the link: In The Money
Heather
Trade the tide not the waves
Q & A
- The Big Three & PFOF: Bryzgalova, S., Pavlova, A., & Sikorskaya, T. (2023). “Retail Trading in Options and the Rise of the Big Three Wholesalers.” The Journal of Finance.
- Retail Performance: Bauer, R., Cosemans, M., & Eichholtz, P. (2009). “Option Trading and Individual Investor Performance.” Journal of Banking & Finance.
- Performance Envy: Kaszás, D., Zeisberger, S., & Hölscher, C. (2023). “The Influence of Upward Social Comparison on Retail Trading Behaviour.” Scientific Reports (Nature Portfolio).
.
Related Posts
- Planning to Lose
Stop Losses: Planning to lose? I am often asked why I don’t use stop losses…


9 Responses
Hey Heather ! Hope all is well! I am working my way through the new book I love how everything feels more condensed and straight to the point! I’ve just finished chapters 10 and 11 and had a question about rolling up. As defined in the book rolling up simply means trading up for a higher strike but leaving the expiration date the same. My question is at what point is an expiration date to close to just roll up and not out at the same time ? Example : if there is say 2.5-3 months left until the originally bought expiration date should we go ahead and roll up and out ? As a future example QQQ has a roll up at 50% of 53x what were the perimeters for those in relation to expiration ? ( I may have just completely missed this while reading lol )
Thanks always for you time and this blog 🙂
HI Joseph – sorry for the late reply – have moved this to this week’s blog.
x
h
Hi Heather,
Thank you for weekly blogs as always. In the United States, we will have a new chairperson of the Fed, Kevin Warsh. Uncle Jerome Powell has already served 8 years from 2018 to 2026. In California, we are having a few people running for the governorship and I am thinking of voting for Steve Hilton, an American British. Please live well and keep on working and walking for world peace.
Sincerely,
George Henry Robert
HI George Henry!
I have noticed in the press that there are several contenders in California – they seem to think that Newsome is a shoo-in. Haven’t actually read anything about Steve Hilton – must have a low profile?
x
h
Hello Heather
I remember the Flash Crash well, speaking of which —- have you noticed any seasonality with ITM? The old adage was to sell in May, and go away. I think the last few years have belied that.
Your book, and in fact your strategy, is the only financial tool I use now. I will let others follow “best stock to buy today!” I only wish I had discovered you much earlier, instead of the financial touts that emerge like Spring weeds.
You are a treasure, in more ways than one.
Roger
HI Roger – thank you!
I really do aprectiate your lovely comment.
Re seasonality of iTM – no have not noticed anything – I think we looked at ‘sell in May and go away’ in a blog last year and found that there was not basis – other than historically investors went out of town and returned after the hunting season (in England, St Swithin;s Day) or summers on the beach in the US.
So, no seasonality that I have noticed – just things tend to be a bit unpredictable over Xmas / NY.
x
h
Hi Heather,
Obviously, we follow the rules of ITM, but I am wondering if you think the new fed chair on May 15 will rock the market a bit?
Got your book, it’s great!
Thank you,
Jason
Hi Jason – its an odd situation – Powell staying on, rahter than departing gracefully as he is supposed to. I believe it is only the second time in 113 years that this has happened.
Clearly it will make the incoming chair’s life more difficult, especially with 2 governors under investigation.
Powell being investigated for irregularitites in renovation costs, Lisa Cook for mortgage fraud – really it is a bit of a worry! I have read both that the Powell investigation has been stopped, but on the other hand he recently cited it as hois reason for staying. . . . so I just don’t know.
Do I think it will move the market? I don’t really think so – with Powel and coook – and I believe 2 others – who will block any major changes, I guess the only thing that will increase is the infighting.
I understand the new chair wants to curtail the governors all giving speeches and interviews – stop them becoming media darlings – so that might actually calm things down.
All just conjecture on my part!
x
h
Thank you! Love your insights as usual: