


| Why Smart People Go Broke |
You’ve just thrown 20 heads in a row; what are the chances of the next toss being a head?
Of course, we all know the answer – at least, in our logical brain. The coin has no memory, no motive, and no awareness of what came before. The odds of the next toss being heads are still 50%.
But in the stock market, traders throw this reality out the window. Trading behaviour shows that under pressure, humans become deeply irrational.
Video
Podcast
The Monte Carlo Fallacy
We start believing that after a long run in one direction, the market somehow “owes” us a move in the other.
- “The market has gone up too far – it has to crash.”
- “This stock has fallen for eight straight days – it must bounce.”
- “We’ve had too many green candles – a red one is due.”
This is called the Gambler’s Fallacy – the belief that after a streak of one outcome, the opposite outcome becomes more likely, even when the underlying probabilities have not changed.

It is also known as the Monte Carlo Fallacy after a famous incident at the Monte Carlo Casino in 1913, when gamblers watched a roulette wheel land on black 26 times in a row and began betting heavily on red, believing it had become “due.”
They lost millions. Why? Because the odds on the next spin had not changed.
Me too . .
And I am not immune from that either – I have been twitchy about the upward trajectory for some weeks – and have been proved wrong.
Thank goodness for the ITM strategy and the clear signals – otherwise I would have missed out on a lovely bull run.

When Traders Start Thinking Like Gamblers
In an article with the deeply enticing title of Idiosyncratic volatility shocks, behavior bias, and cross-sectional stock returns what the researchers found was surprisingly simple.
When a stock suddenly becomes much more volatile (its price starts swinging around wildly) – investors tend to misread what the volatility means.Instead of responding rationally to new information, many fall into psychological traps like the:

- disposition effect – holding losers too long and selling winners too early
- gambler’s fallacy – believing that after a big move in one direction, the opposite move is now “due”.
Earnings streaks & investor underreaction
A well-known market study found that investors systematically underreact to long streaks of positive earnings surprises. The researchers linked this to the gambler’s fallacy — investors subconsciously expect streaks to end.

So for example:
- company beats earnings 5 quarters in a row
- investors think “surely this quarter disappoints”
- the market underprices continued momentum
Mean Reversion
This is my pet hate: the idea that somehow prices have to ‘revert to the mean’.
Oh, really? If you had been waiting for the Dow to revert to its mean from a hundred years ago – well, good luck with that!
Yes, mean reversion is a genuine statistical concept. But many traders apply it to markets incorrectly. They assume that after a strong move prices are somehow “due” to snap back. They believe markets must “balance out” even when there is no statistical reason they should.
Markets are not random coin tosses. Over long periods they have shown a strong upward trend driven by earnings, productivity, population growth, inflation, and human progress itself.

Smart People Losing Money
Trader and researcher Ralph Vince ran a fascinating experiment.
Forty highly educated people – many with doctorates – were placed in a simulated trading environment. None had trading or statistics backgrounds.
Each participant started with $1,000 and was given:
- a system with a 60% win rate
- equal wins and losses (1:1 payoff)
- and 100 trades.
In other words, they were handed a game with the odds already stacked in their favour.
So what happened?
- Almost all of them lost money.
- Only two participants finished ahead after 100 trades.

Why?
Because after strings of losses, many increased their bet sizes believing a win was now “more likely.” Others became fearful after losses and reduced their position sizes just before winning streaks. In other words, they abandoned probability and started trading emotionally.

The odds never changed.
The system still had a 60% win rate.
But the participants behaved as though recent outcomes somehow altered future probabilities.
That is the gambler’s fallacy in action. And it explains why intelligent people can still lose money in markets despite having a profitable system.
The ITM Strategy Protects You
The market does not care that you think a reversal is “due”
That’s why it is important to have an objective system – and ITM is an objective strategy, not one that depends on our emotions.
Sure, we have emotions – we can’t stop them – but we can decide not to act on them.

ITM waits for evidence of reversal, not the feeling that reversal is “due.”
To the markets . . .
A rather nice week. More new highs. Yet again indicators have been proven wrong! Let’s check:
SPY Charts
SPY continues its upward trend – still no massive volumes but that doesn’t seem to bother it. I have left the MACD on the chart – showing the divergence – but guess what? Its prediction was wrong! Quelle surprise!
The histogram has started rising again – albeit quite slowly, but that is because the recent rise was so sharp and so the plateauing had a big effect on its downtrend.
As I say – probably ad nauseum- indicators work some of the time – we just don’t know when they are going to work.
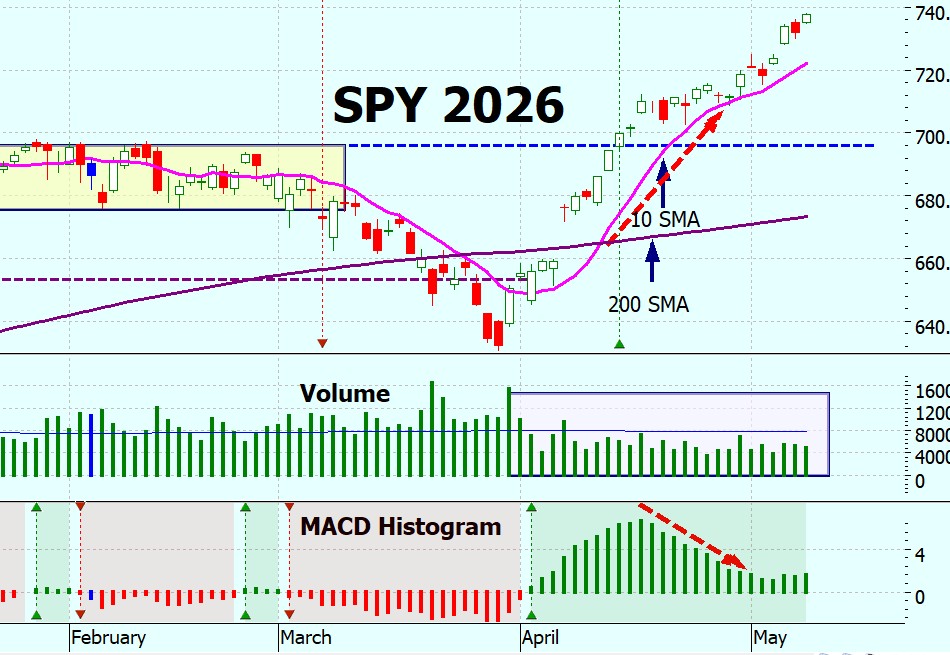
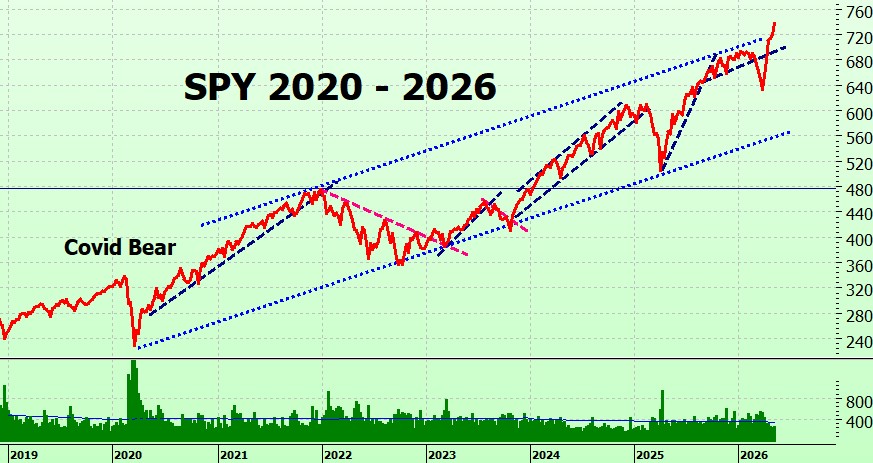
On the log term chart SPY has breached the top of the trading channel. What does this mean? (Read over the blog before you give an answer!)
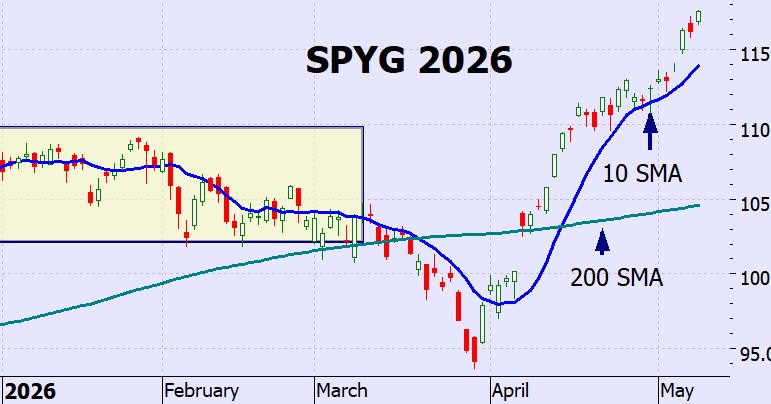
SPYG Charts
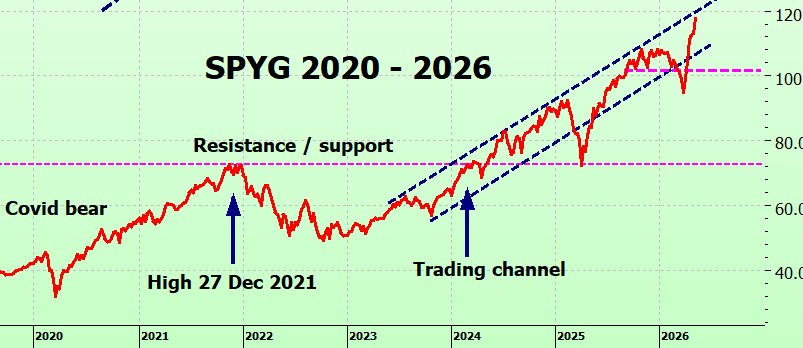
SPYG has definitely broken out of its consolidation period and headed upwards again.
And long term:
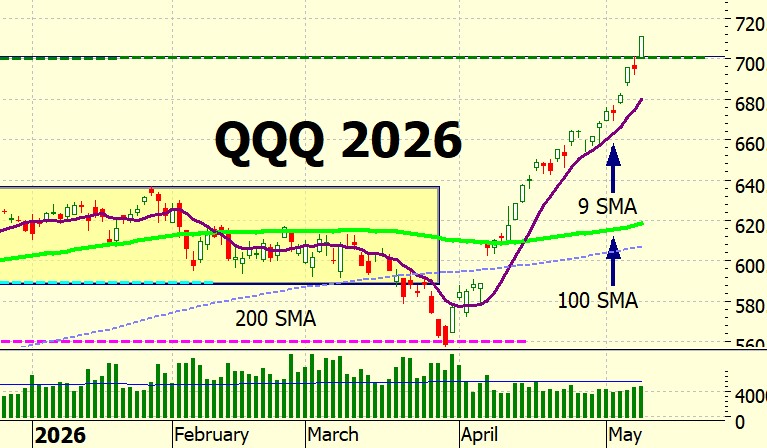
QQQ Charts
That is one very bouncy chart! $700? no problem! It is catching up rapidly on SPY.
Here are all three compared for the last 20 years (percentage increases):
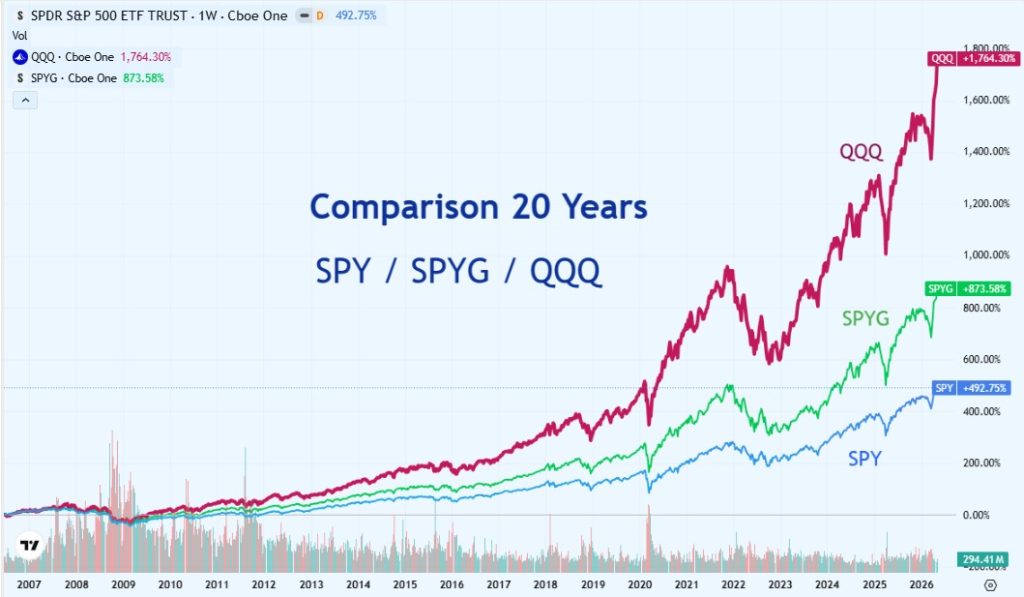
QQQ makes SPY look positively sluggish!
(BTW – this was created here: https://heathercullen.com/stock-charts/. I notice when checking analytics that charts are not being used a lot – so it is just a suggestion. Hours of fun!)
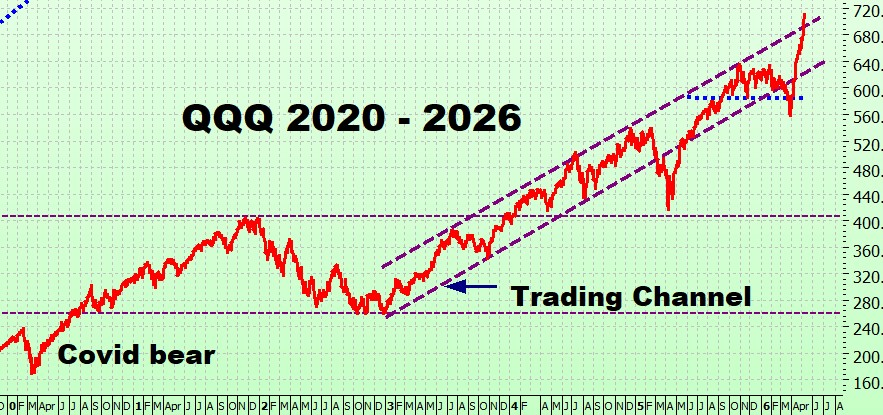
On the long term chart QQQ also has pierced the top of the channel – as for SPY, check the blog above before deciding what it means!
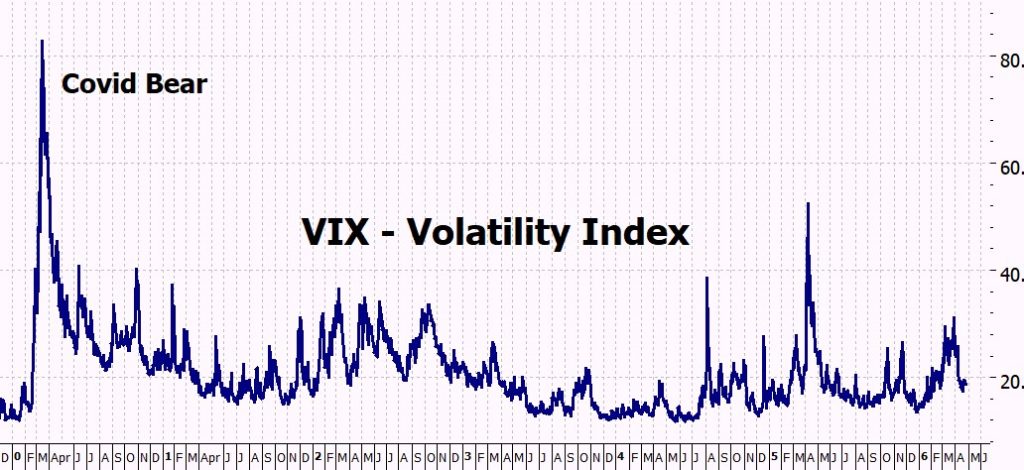
VIX Chart (Volatility)
Still low volatility.
ITMeter

The week ahead.
Inflation data will dominate markets this week, with CPI and PPI likely to drive expectations around interest rates. Markets are still being pulled between AI optimism, geopolitical tensions, and concerns that inflation may remain stubbornly high.
Monday – May 11
• No major U.S. economic releases.
• Earnings: Fox Corp, Monday.com, Constellation Energy.
Tuesday – May 12
• CPI (Consumer Price Index).
• Earnings: JD.com, Robinhood, Under Armour.
• CPI will be closely watched for signs inflation is reaccelerating.
Wednesday – May 13
• PPI (Producer Price Index).
• Earnings: Alibaba, Cisco, Dynatrace.
• Cisco and Alibaba may provide further insight into AI infrastructure demand and global tech spending.
Thursday – May 14
• Retail Sales, Initial Jobless Claims.
• Earnings: Applied Materials, Figma, Nova Measuring.
• Applied Materials is a key read-through for semiconductor and AI capital expenditure.
Friday – May 15
• Industrial Production, Consumer Sentiment.
• Earnings season slows.
The three AI stocks reporting this week:
- Cisco – AI networking infrastructure demand.
- Applied Materials – AI semiconductor capex.
- Alibaba – can AI revive cloud growth?
Nvidia reports next week – but increasingly the AI race is no longer Nvidia alone. Google is now challenging Nvidia for AI leadership and is rapidly closing the gap in market capitalization.
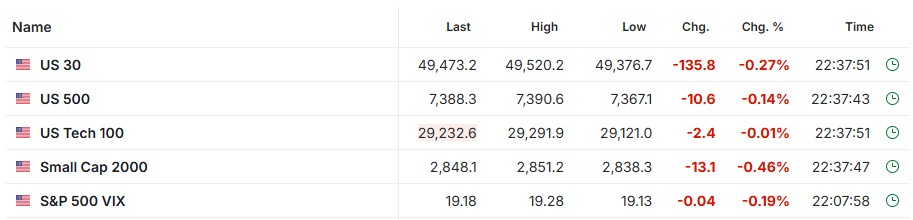
The futures
Relatively flat – although I notice that the Russell is down a bit more. I think I really need to start checking that out, possibly offsetting the charts – ignore this – thinking to myself.
It’s May – why are you not in France?
If you have been following the blog for a while you would know that I usually spend my Australian winters travelling, and in May I am usually in France (the weather is great, everything is open, and there are no crowds). This year I’m giving it a miss as I am moving into my new place and want to sort that out. Here’s my new view:


22 Responses
Heather, This one really spoke to me. I’ve spent years doing all the stupid things, especially the falling knife. I see a lot of traders doing that. I just started using a system that has parameters that line up to the example in your article – 1:1 risk, 60% probability, etc. It’s selling Put Credit Spreads. I know that my ability to handle losing streaks will be my challenge. I was also considering the martingale (doubling bets on losses) but will not do that now that I’ve read this. Thank you!
HI Thor – glad it was of help.
The martingale sounds so logical and reasonable – until you do the math! Terrifying.
PLease keep us posted about your put credit spreads – I’m sure a lot of people will be interested )including me!)
x
h
Will do! Expect the first update in about 30 trades, roughly 90 days.
excellent! Look forward to it!
x
h
You could have sprinkled my name throughout this blog as someone who has done all of these things. I missed the latest spyg move and entered way late. My prognostication on the effect of the Iran situation being totally wrong of course. So….given a late entry should I set a faster exit than the death cross? I’m anxious about having added more downside risk.
HI Steve – we’ve all made mistakes – and we are all brilliant trades in hindsight!
The ITM has been backtested from entry signal to exit signal – so as you would expect traders joining the trade some time after the signal won’t get the same results – but that isn’t to say that it is not worth joining. Some trades we have been in for several years (with rolling of actual positions of course) so not entering because you were not there right at the start would have been a big mistake.
That’s not to say that we will be in this trade for years – we have no idea how long the bull is going to run.
Re setting a tighter stop – yes, you can do that, but then you are not trading the ITM strategy, so I would have no idea what your results would be. I have tested hundreds of different combinations and most of the ones with tight entry / exit did very badly – crashing and burning way before we got the 33 years!
The downside risk is, of course, worrying, You could use a protective put – but as I point out in the book , it is very expensive ‘insurance’. However, if it helps you sleep at night it may be worth looking at.
Hope this helps
h
Love your book and blog. I don’t see how you find the time. You must love what you’re doing for us your devoted fans. One recent blog that I have been thinking about is the one you released on March 2, 2026 AI Disruption. It was accompanied by an article “The 2028 Global Intelligence Crisis Citrini Research.” I have been noticing a few articles in the newsfeeds about layoffs in the tech sector. This news is not alarming yet but I find it interesting. Kind of tracks with your blog and the Citrini essay. Am I being paranoid?
Thank you much for all you do.
Hi Andy – just because you’re paranoid doesn’t mean they aren’t after you! (apologies to Joseph Heller).
Seriously, AI is really going to change everything – but we are looking at it in terms of bigger & faster ‘what is’ rather than a transformational ‘what could be’. A bit like how early internet adopters saw is as just an online brochure (remember ‘Our Mission’, ‘All About Us’?). No-one at the time saw it as the all-pervasive all-purpose tool it is now.
And that’s how I think we are treating AI.
Re the tech sector – when I first used AI around 3 years ago I quickly realised that I never had to read a tech manual again – and shortly after realised that coding was going the same way as the quill pen. Yes, we will still need tech skills – but they will be completely different to the ones in the past. Most current tech jobs will go the way of draughtsmen and shorthand typists.
Hmmm – I do tend to run on about this stuff . . . hope it answered your question?
x
h
P.S. – thank you for your kind words and glad you find the blog useful. I actually love writing, I am passionate about the stock market and have a seemingly insatiable appetite to learn thngs – so it seems like a natural marriage. Well, threesome I suppose. In real life I don’t have any friends who trade – so this is my trader friendship group!
Hey Heather ! Hope all is well! I am working my way through the new book I love how everything feels more condensed and straight to the point! I’ve just finished chapters 10 and 11 and had a question about rolling up. As defined in the book rolling up simply means trading up for a higher strike but leaving the expiration date the same. My question is at what point is an expiration date to close to just roll up and not out at the same time ? Example : if there is say 2.5-3 months left until the originally bought expiration date should we go ahead and roll up and out ? As a future example QQQ has a roll up at 50% of 53x what were the perimeters for those in relation to expiration ? ( I may have just completely missed this while reading lol )
Thanks always for you time and this blog Joseph
Hi Joseph – glad you like the book – I tried really hard to get it right!
Re rolling out: I usually use 30 days as a rule of thumb. Although we have very little time value on DITM options, it does decrease to zero at expiry/ Most of that decrease is in the last 30 days so it makes sense to avoid it.
Re rolling up and out: In the example you gave I probably would roll out & up – no reason other than it saves rolling again in a month or two.
It doesn’t make an enormous difference in the results whatever you chose, but I do recommend you make it a habit to roll at 30 days.
Hope this helps
X
h
Hey Heather !
I’m sitting here in my car reading the new book on my break 🙂 . On page 141 of the paperback book it states every dip or correction in the last 3 decades was preceded by an ITM OUT signal except on some occasions where it didn’t fall past more then 5%. My wondering is if that is the case have you ever back tested a percentage drop as an out signal ?
Thanks always
Hi Joe – I seem to have spent a ridiculous amount of time backtesting – I think I have backtested practically everything!
I do remember testing for drops of x% – and got nowhere, as in no good results. Presumably because you have to use time as a parameter also – for example a 6% drop in 2 days is different to a 6% drop over 2 months. Which one do you test?
Or do you test just any drop of 6%? and if the results were inconclusive (as in they showed no good result) was it because you didn’t use time as a parameter?
As always getting out is easy and getting out on a X% drop makes sense – but the problem always is: what signal do you use to get back in again?
So – yes, I have backtested it – but it didn’t make the grade as a strategy I could trade, and I can’t actually remember the results (it was a while ago), just that they were not good.
X
h
I have your latest book and the one before that. I did 3 contracts on SPY options April 23 and added 1 contract on QQQ option on April 29. Wish I had known about In The Money before. ASteve
Hi A Steve!
Me too! As in I wish I had figured it out 20 years ago!!
Oh well – old chinese proverb: the best time to plant a tree was 20 years ago; the next best time is today.
x
h
Hi Heather, I bought your latest book on Amazon and I really like the strategy you provided! I do have one question: Previously, I thought I read somewhere, either on Amazon’s review, or on your website here, that there was some type of a typo in a percentage number in the book, and you responded to that comment by saying something like, “no matter how many times I proofread, there can always be a typo”. I can no longer find that comment again. I just want to ask if that typo is substantial enough to change your strategy (like 65% instead of 45%) so I should be aware of please? Thank you. Jeff
HI Jeff – I think it must be one of the previous books – I haven’t had any notifications of mistakes in this latest one (shouldn’t say that – tempting fate!!).
If there was a typo it certainly was not a significant one – from memory there was one example, I think it was in the bear strategy book, where I duplicated the percentage from the the previous example. Not sure.
But no, there is absolutely nothing significant if there are any typos in this book – and there should be none! I dumped all the chapters one by one into 2 different AIs and got them to check for syntax, check all my definitions and claims, and work through all the examples to make sure they were correct – something not available when I was writing previous books.
So – if you have the latest book – you can rely on the figures.
x
h
Another emotionally-driven response I have not always handled too well is the “gotta do something itch” when the strategy says “go fishing”. Another feature I like about the ITM strategy is that when leverage decreases significantly after a run-up, one does have the option to roll out and/or up. One way to scratch the itch without doing something stupid. Thank you.
HI Brad – yes, I know the ‘I just want to DO something itch’ – I have it frequently.
How I currently scratch it is selling covered calls against SPY / QQQ – as I mention in the book I keep a percentage of my portfolio in straight (unleveraged) shares – and when I get the itch I sell OTM 2DTE against them.
Honestly, it is hardly worth it – I should probably do another blog on it – I just treat is as therapy to avoid doing anything really stupid.
I’m definitely not recommending it as a way to make money! Its just a way to keep my impatience in check – scratch the itch – and it is a good reminder on how investing time and effort into something like that is really not worth it for the payoff!!
x
h
Very timely!
Boy did I need to read this week’s blog and I’ll bet I wasn’t the only one.
Thank you heather
Hi Jim – glad you found it useful.
Yes, it was on my mind last week.
When thinking up BLOG topics I always think of what is bothering me / taking up my brain space at that time – then write about it on the assumption that probably others are bothered about it too.
x
h
Kinda like the Elliott wave theory… since the stock market has made a great move up since someone invented a slice of bread it’s ready for the great slide down for a decade or more.
R
HI Randy – Elliott Wave . . . .honestly I was such a sucker for that.
Having a BG in math, naturally I had a great respect for the Fibonacci sequence, and thought this was going to be great. I persevered for a few monts thinking I must be doing it wrong (i was losing money) – but then what really bothered me was the way that they would revise previous waves they had already established based on new data – rewriting the past!!
No-one can trade like that unless they have either no memory or are delusional.
I decided to give it up while I still had some money left to try something else.
It was a good decision!
x
h