


SPY went up – options went down!
Annoying? Oh, yes. SPY goes up – and your options go down. How can this be? Last Thursday was a perfect example.
Thursday 4th December
The S&P had a perfectly decent day. SPY crept up +0.07% – nothing dramatic, but green is green. So, you’d think your options would also be green.
Ummm . . not so fast. Some would be, some wouldn’t. Some went off and did their own thing entirely.
DITM Vs ATM Vs OTM
This is one of those days that shows exactly how shares, deep-ITM calls, ATM calls, and OTM calls each have their own personalities – and results. For this example, I am using an account with SPY shares and a mix of SPY options:
- DITM: strike $410
- ATM: Strike $680
- OTM: Strikes $700 & $710.
All were calls expiring 20th March 2026.
Shares: the adults in the room
The SPY shares just did what they always do: followed SPY. SPY was up +0.07%, and the share position was up by about the same.
Calm. Predictable. No surprises. Exactly what you would expect.
DITM calls: like shares, just better
The DITM ( deep-in-the-money) SPY calls (the 410 strike) behaved beautifully.
They were up +0.15%, slightly better than SPY itself. And that’s exactly what a DITM call is meant to do, and the basis of the ITM strategy.
- high delta
- minimal time decay
- not too sensitive to volatility moves
The options with the 410 strike were at 60% of the current price when I bought them, so within the ITM strategy guidelines.

(Quick refresh: delta measures how much an option’s price is expected to change for a $1 move in the underlying. A high-delta option moves almost point-for-point with the stock.)
ATM calls: where things get twitchy
Then we get to the 680 strike – not perfectly at-the-money, but close enough to behave like one and to illustrate the point.

SPY managed a tiny rise. The 680 option? Down –0.38%. Why? Because ATM calls care about everything:
- the underlying price
- volatility
- time decay
- air pressure
- planetary alignment
OK, the last two aren’t technically true, but it feels like it some days.
When SPY moves only a whisker, theta and any drop in implied volatility can easily outweigh the gain. Thursday was one of those days.
OTM calls: the drama queens
Now for the real offenders. The out-of-the-money SPY calls – 700 and 710, They were down –1.26% and –2.02%.
Not nice at all, but this is absolutely standard behavior for OTM calls when:
- the underlying only creeps up
- volatility slips
- delta is tiny
They simply don’t get enough “push” from the underlying move to overcome time decay and volatility contraction.
So SPY goes up a fraction… and the OTM options throw themselves down the stairs.

So why am I in them at all? Playing. And understanding exactly how they move so that I can explain it.
They make up 2.3% of the account – well within my self-imposed limit of 5% for OTM. And – self-justification, not recommendation – they’re not far OTM and could end up ITM by expiry. Maybe. But in any case, I’ll be selling them in January before time decay really sets in.

The whole day summed up
- SPY: +0.07%
- Shares: up
- Deep ITM: up
- ATM: down
- OTM calls: down (a lot more)
And the overall portfolio? Dragged into the red by the IV-sensitive options. The ups weren’t enough to offset the OTM options.
What to remember?
- Shares behave.
- Deep ITM calls behave.
- ATM calls can be temperamental.
- OTM calls are basically volatility bets in disguise.
And days like this – gentle SPY rise, softening volatility – are exactly when the differences show up most clearly.
Volatility crush?
Something we’d rather not be involved in!
To the markets . .

Well, not much happened last week – nothing bad, but nothing really good. Just consolidation – which is to be expected. Traders are holding fire until they see the results of the Fed meeting on the 11/12 Dec.
SPY Charts
Five days with five little candles – but each candle closed higher than the day before, even in the 2 down days. It hasn’t yet matched its previous highs, but only a little way off.
I quite like little candles; to me they mean that traders are pretty much in agreement about the ‘correct’ value of SPY. No crazy bears, no major bulls – just a nice orderly progression. Lower than average volumes, but that’s probably due to traders holding off until they see what the Fed is going to do.
Not very exciting I know – but maybe we don’t need excitement right now!
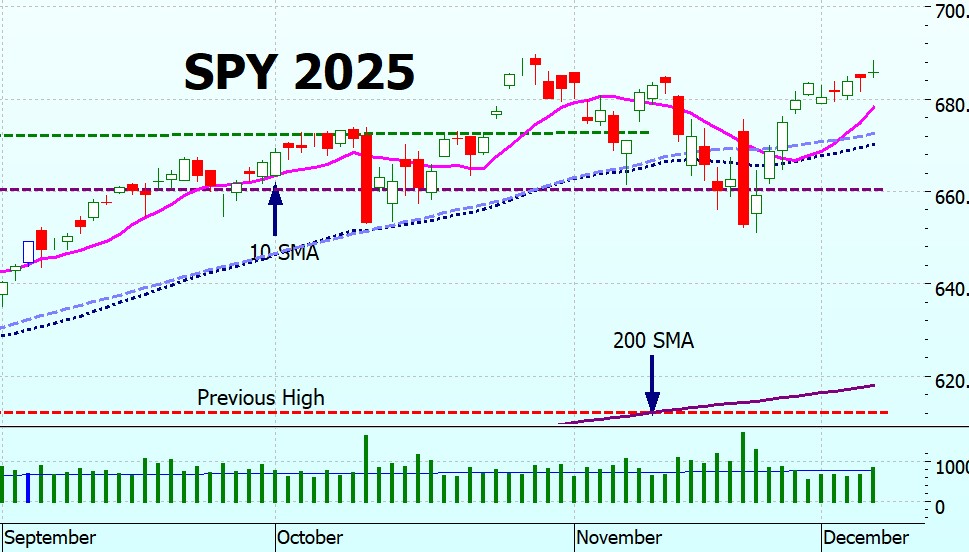
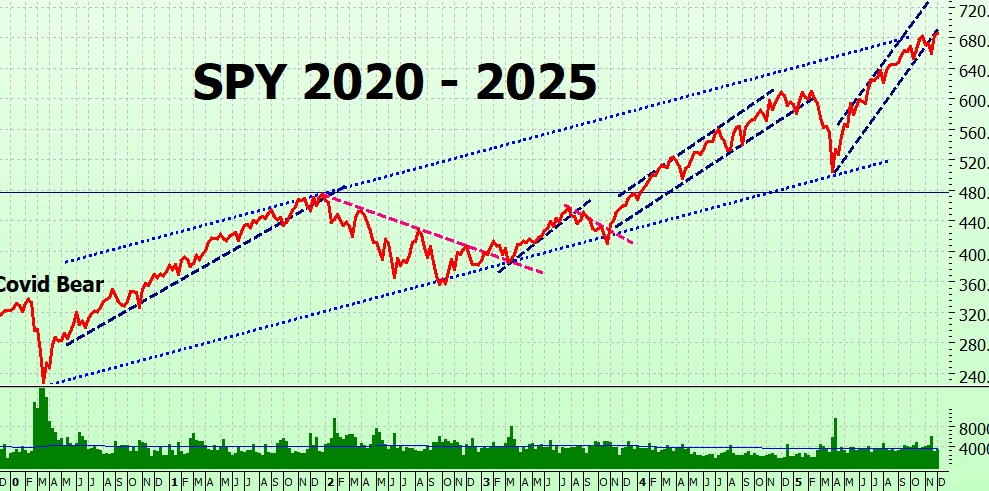
On the long term chart SPY is still at the lower bound of its trading channel.
SPYG Charts
SPYG is following the lead of SPY, and similarly hasn’t yet reached its previous high. But it’s close.
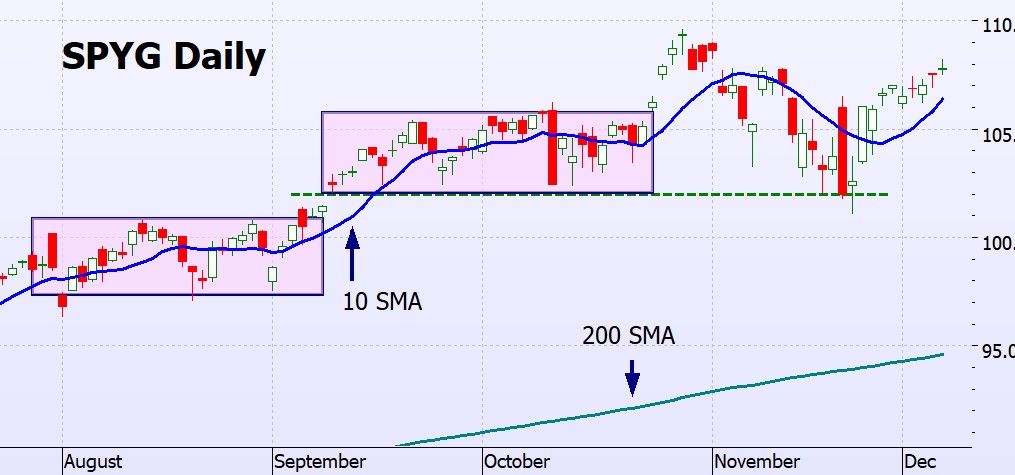
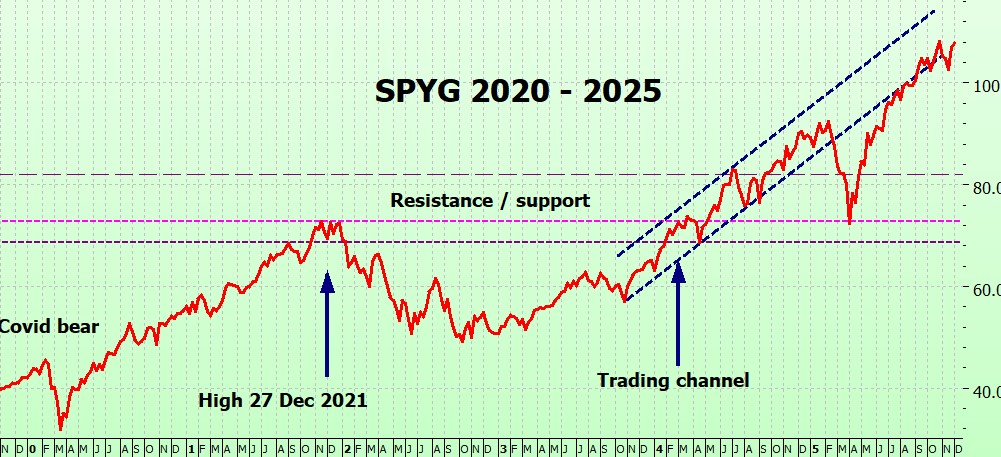
On the long term chart, like SPY it is on the lower bound of the trading channel.
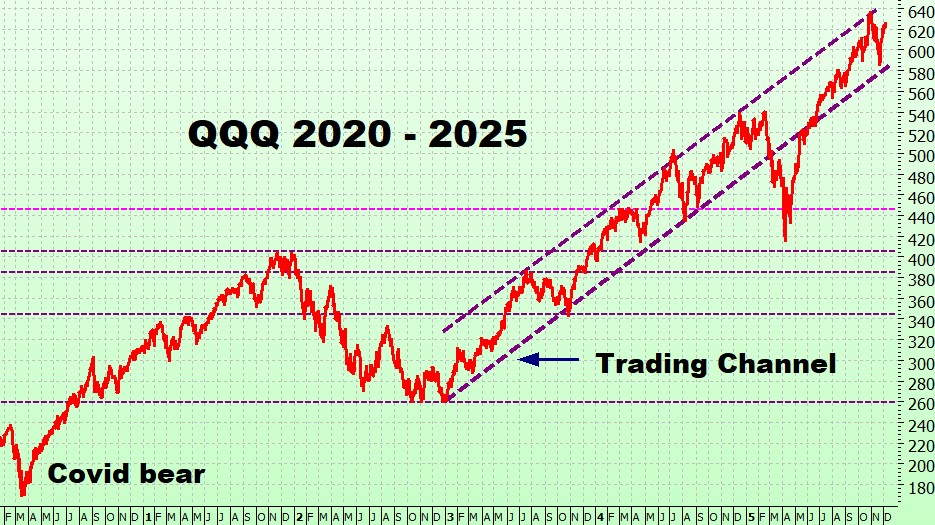
QQQ Charts
Just like SPY, a nice orderly procession of little candles going up nicely.
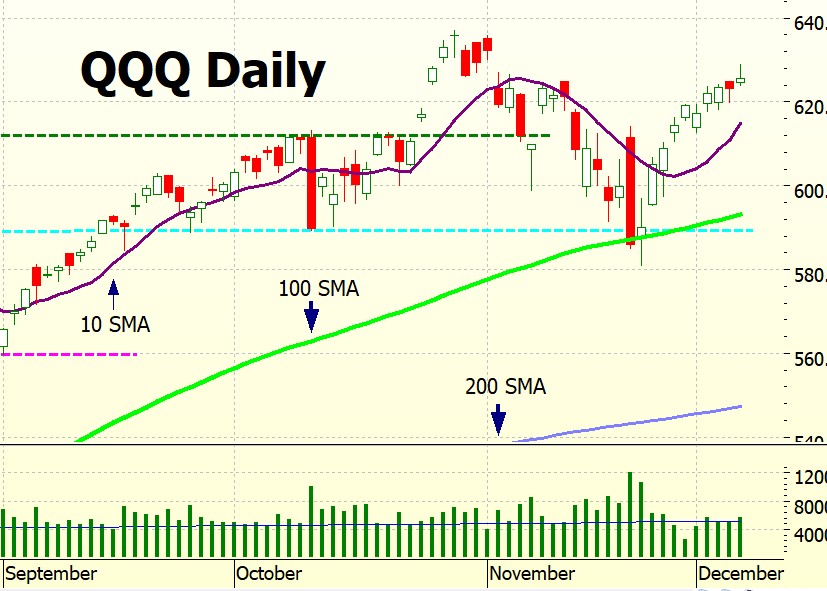
And right in the middle of the trading channel. (an aside – doesn’t the covid bear look like such a little blip? That’s linear charts for you!)
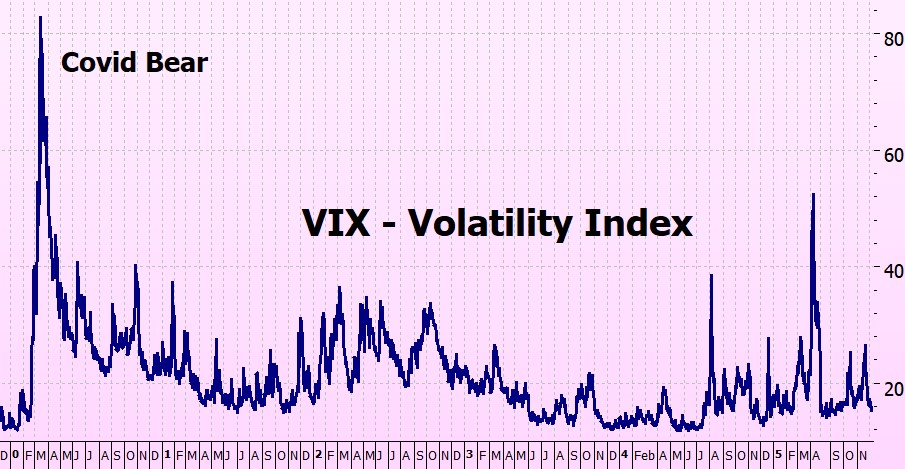
VIX Chart (Volatility)
The VIX has settled down – looks as though it is ready for another blip. Let’s hope not.
ITMeter

The week ahead. . .
. . is dominated by the Fed meeting. Markets are convinced it is going to happen. Jerome Powell is playing gooseberry saying that it ‘is not a foregone conclusion, far from It.’ His term ends in May 2026 and he is clearly not a fan of the President so he may want to make the last few months as uncomfortable as possible. Who knows?
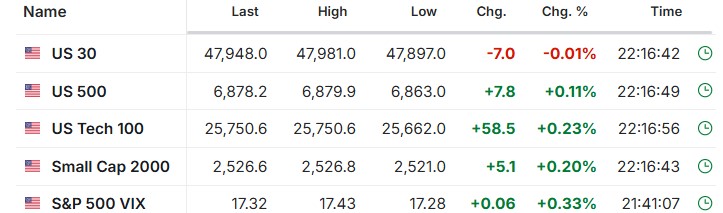
The Futures
The futures are looking slightly positive, I guess traders are anticipating a rate cut this week!
Back from Down South
Had a lovely, lazy few days in Yallingup / Margaret River, the main wine-growing region of WA – but back now and it is full steam ahead to get the new book ready for January.
Fingers crossed for a good week!
Heather
Trade the tide, not the waves
Q & A
Related Posts
- SPY Golden Cross
Is the bear leaving us? In the blog last week, I foreshadowed that the ITM…
- ITM Special Update: SPY and SPYG
ITM Update: SPY and SPYG Well, a very disappointing week, although not unexpected. Last week…
- Why are options expensive?
Why are options so expensive? Expensive options a great if you are a seller –…


13 Responses
Have you heard about Wall St. petitioning the SEC for the market to be open 24/7? What, if any, impact do you believe that would have on the ITM strategy?
Also, is your new book available for pre-order?
Thanks!
Kevin
HI Keving – sorry – am a but behind with questions – apologies~!
h
Heather, what to say on a day like this? I am so sorry that peace was shattered at Bondi. My deepest sympathy to Australia and what a hero Ahmed El Ahmed. His courage is remarkable.
Hi Kate – it is simply awful – those poor people. But that brave guy who ran towards and disarmed the terrorist – what courage!!
x
h
Surely looking forward to that new book — it sounds like you are combining the ITM and ITMB updated material into one book. Also looking forward to your insight on updated trading parameters for QQQ (or at least I think I saw a comment from you on that). It will be a great book, no doubt about that. I hope it generates more interest than the Epstein files and sells very well!
Hey Brad – yes one book, bull and bear, including QQQ – and lots of additional supporting material on a special section of the website.
Then I am going to unpublish the other books. I have tried to make it future-proof so this will be my final, definitive ITM book!
I often think that I should have maybe tried my hand at something like ’50 shades of grey’ – but I thought it the most utter drivel and stopped reading after a couple of chapters. But there’s no getting away from the fact that she made a fortune!
Thank you for your best wishes!
x
h
Hello Heather
I still enjoy my morning cup of Joe reading your emails keep up the great work. Just wondering if you ever looked at your strategy using the ETF OEF simply the s&p top 100 looks like it tracks very well against the s&p and has a better return so just in theory your strategy should work and the cost of the contracts would be much less. Thanks.
HI Michael – I had to look up Joe’:
he most accepted origin is U.S. Navy slang from the early 20th century: sailors referred to coffee as “Joe” after Josephus Daniels, the Navy Secretary who banned alcohol on ships in 1914 — coffee became the standard drink, so a “cup of Joe” meant a cup of coffee.
I’ve had a look at OEF – yes it is cheaper but have 2 main reservations:
1) the range ot options is limited. The lowest for June 2026 (the farthest expriy date) is a strike of $285 – which is 83% of current, so not very DITM.
2) The spreads are big – for the 285 strike the bid / ask spread is almost 8% so not very liquid. Checking the OI – it is completely zero for June 2026, so you would have to go with the bid / ask, no other buyers.
So – no – I think SPYG is a better bet.
Hope this helps
x
h
Hi Heather, is it feasible to know what the new book is about?
HI Alejandro – the new book covers both bull and bear strategies. The bull is extended to QQQ, and the bear strategy had to be updated due to the huge increase in SPY since it was originally published. I have removed some of the basics (instead giving away my book Reading Stock Charts free with the book) – new bits , new checklists, updated backtesting – and a complete all-singing-all dancing website with quizes, images, podcasts, key concepts, glossaries, and more) .
I have some other ideas – like creating material fr book clubs and schools / colleges – I think I may have to curb my enthusiasm and take my sights dn a little – but I have draftes and tested everything and it works.
ETA – late January – going to have a busy Xmas / MY!
x
h
I have found the advantage of experimenting with (a few) far OTM options is that the extrinsic value increases rapidly with IV spikes during quick market declines. In addition (as a result of this???), the delta changes quicker which acts almost like you are adding to winning positions and subtracting from losing positions as all of the greatest traders have RECOMMENDED. They will not perform as well as DITM in slow moving markets, whether up or down. That is the tradeoff for crash protection.
But…. you really have to use LEAPS (the farthest dated options on SPY), and only a small percentage of your account, just like Heather advises. It’s definitely a more advanced strategy and probably not really necessary.
Hey Michael – I haven’t checked out using really long dated OTM options – but it sounds interesting. Will check it out.
Thanks!
h
I have a few 850 and 865 call options dated Dec 2027. But I still play it the same with the 10-200 cross.