


| The Options Zoo |
Lizards, condors, butterflies. Options trading sounds exciting, doesn’t it?
But underneath the exotic names, these strategies are usually nothing more than combinations of calls and puts.
(BTW: the video is really good this week. Have a look.)
Video
The Wheel
This sounds so logical and comforting. And so easy:
- sell puts on stocks you want to own
- sell covered calls for income.
Podcast
That is, until you realise:
- in bull markets you cap upside
- in bear markets you still own collapsing shares
- the premiums are tiny relative to capital
- long-term compounding suffers badly
In Real Time
We saw this in action last week – the bit I didn’t mention was that I did the other side of the wheel. I sold my shares so that I could do cash-secured puts. Which I did. I sold 3 contracts each of SPY and QQQ.

And collected the magnificent sum of $1,191 against $435,411 in cash securing the positions – a return of just 0.27%.
And look what I gave up!
At the time SPY was trading at $739.83, QQQ at $711.54. They are now $756.48 and $738.31, a total of $448,437. I gave up $13,026 to collect $1,191.

Seriously??
For a strategy marketed as “income”, that’s a remarkably expensive way to generate it.
(OK I could have redone the puts last week, but I have been moving house, so trading is taking a back seat. But even if I had done it twice more it would still be $3K Vs $13k. Whichever way you look at it, a losing strategy.
And yes, I am kicking myself. I like to prove a point – but at the same time I hate losing money! $10k? That’s 20 nights in a very decent hotel in France I’ve just given up.)
Old Dogs . . New Names
But the animals sound so cool! Who wouldn’t want to trade a ‘broken wing butterfly’? Sounds so elegant and intelligent. ‘Short naked convexity with asymmetric tail exposure’ doesn’t have quite the same ring to it

Somewhere along the way, options traders decided that “short put with a call spread” wasn’t exciting enough. So they started naming strategies after animals. Butterflies. Condors. Lizards.
One day someone apparently looked at a green Mexican lizard and thought, “That’s it. That’s my options strategy.”
Many newer traders genuinely think these strategies are new discoveries or institutional secrets when in reality they are just variations on selling optionality.
But . . . why??
Why are so many modern option strategies variations of collecting tiny premiums while quietly selling away upside or taking hidden tail risk?
The strategies are often marketed as “safe income”. Frequent small wins are psychologically seductive and complexity creates an illusion of sophistication.
Many newer traders don’t understand the real risk/reward profile – and the branding is top notch!
How did we get here?
1970s
1980s
Originally, in the 1970s and 1980s, options were used mainly by professionals and institutions for hedging and inventory management. Straddles, strangles & spreads were their tools.
1990s
In the1990s, retail education started to grow – and that was the time I started to get interested in the stock market, learning all about covered calls and spreads, and the odd condor and butterfly if you were being really sophisticated (!).
2000s
The possibility of massive windfalls drew many traders into the market. Unfortunately, massive windfalls turned out to be much rarer than the YouTube thumbnails suggested.
So, attention shifted toward income generation.
2010s
The 2010s, saw the emergence of trading as entertainment. TastyTrade, Robinhood – and above all YouTube – saw options become mainstream. The possibility of the massive windfalls drove many traders into the market – but they quickly realised that they didn’t happen very often (if ever). So, another strategy had to be devised: income generation.
2020s
Now we are in the social-media / gamified era. Strategies such as covered calls, Jade Lizards, Wheels, 0DTE, premium harvesting, daily income culture made the appeal of the market irresistible to many, often young, traders.
The emphasis shifted toward:
- income
- theta
- “high probability”
- frequent winners
- active management
Not that old-fashioned notion of long-term capital growth!

ITM Strips
Away
Complexity
(and effort!)
The ITM strategy focusses on:
- trend
- leverage
- long-term compounding
- staying with the move
The long-term results speak for themselves. We capture major market trends, use controlled leverage to magnify the results, and step aside during reversals. whereas many modern retail option systems evolved toward:
- harvesting noise
- constant management
- capped upside
- short-term reinforcement

Where are we now?
Somewhere along the way, options trading shifted from participating in major market moves to trying to harvest tiny pieces of them.

Has it made more successful traders?
Looking around social media, I’m not convinced. Somewhere along the way, options trading stopped being about participating in major market trends and became obsessed with collecting tiny premiums from them.
The animals became more exotic. The returns didn’t.

To the Markets . .
Rather a nice week – slow and steady gains. I can live with that.
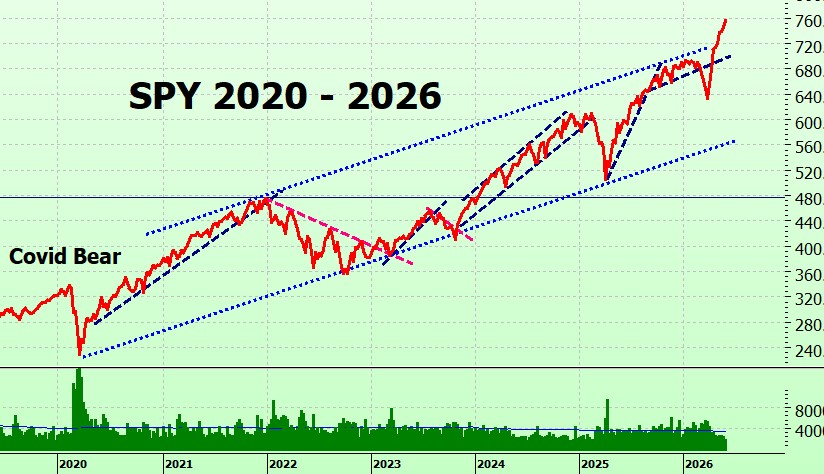
SPY Charts
Nothing remarkable. Slow and steady gain heading back to the trend line.
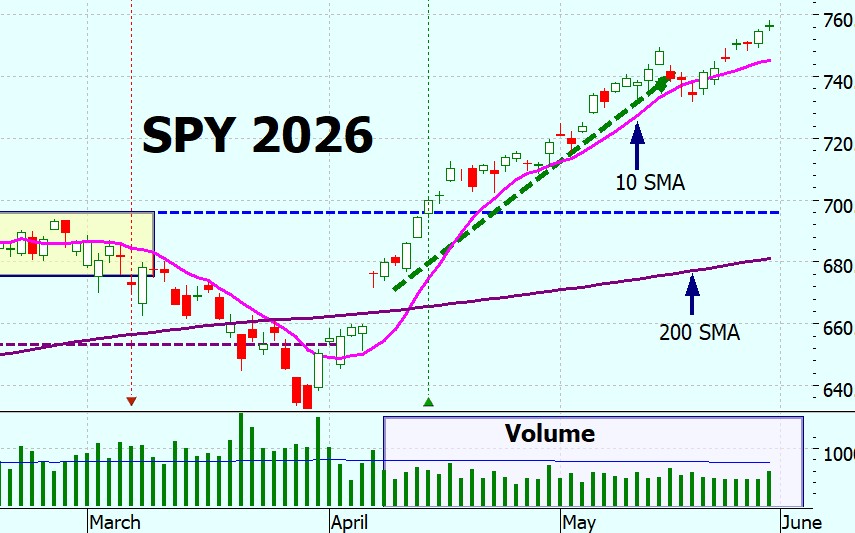
Longer term it is still heading out of the trading channel.
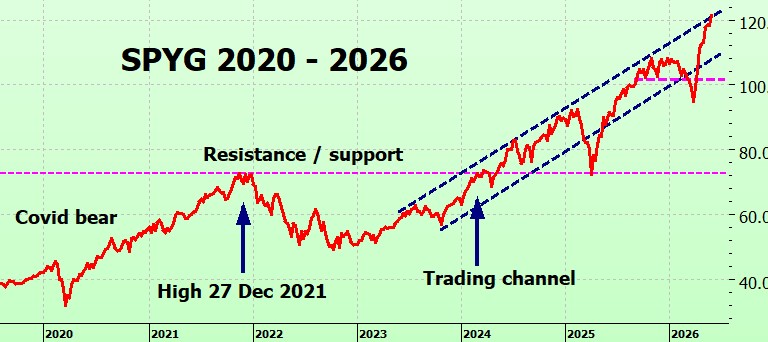
SPYG Charts
SPYG making new highs, twice last week. Nice.
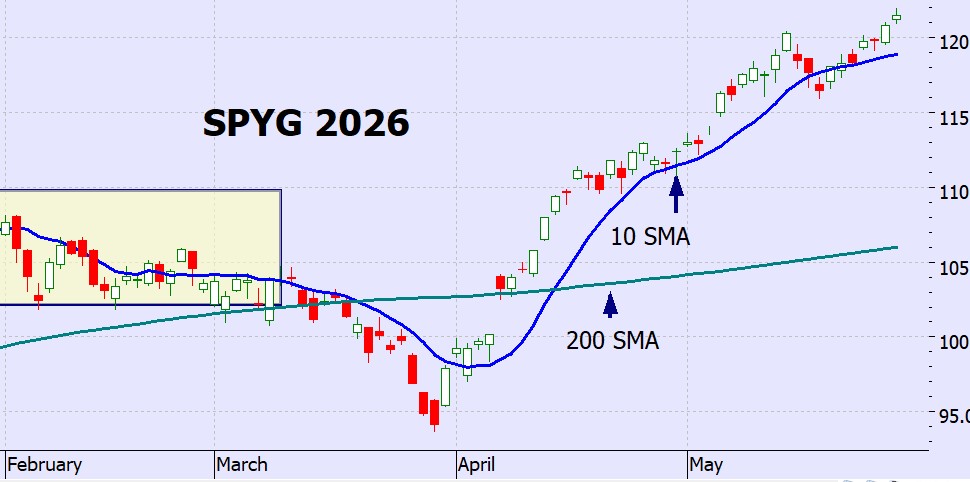
And longer term, bumping up against the top bound of the trading channel.
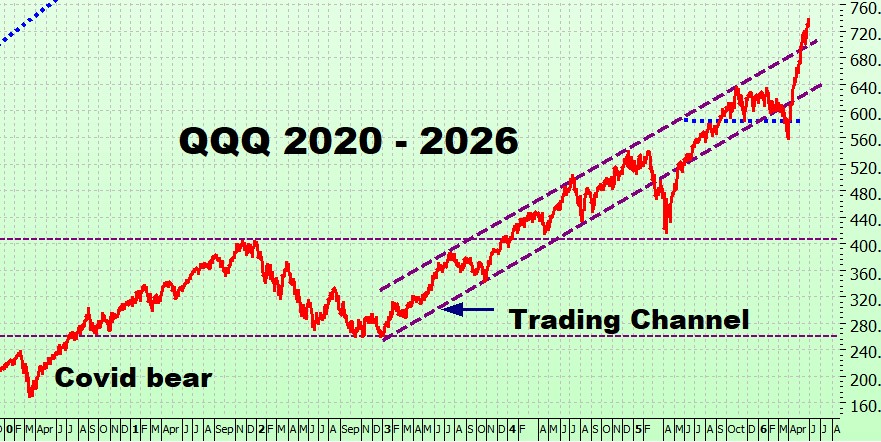
QQQ Charts
This is the kind of chart bulls dream about! 3? 4? new highs this week.
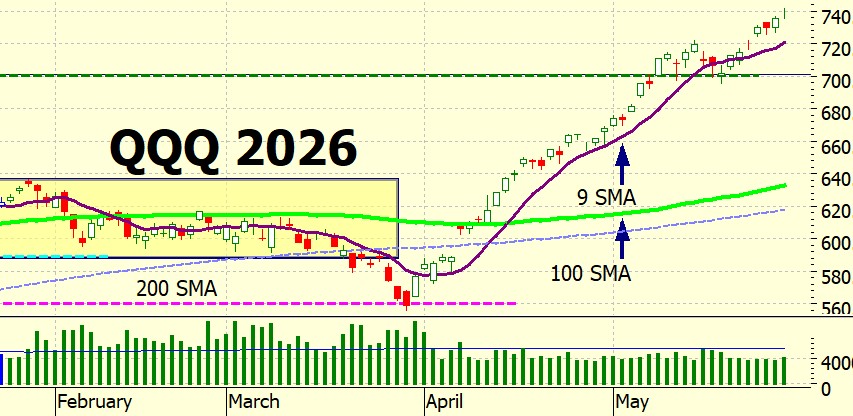
And longer term . . .well you can see for yourself!
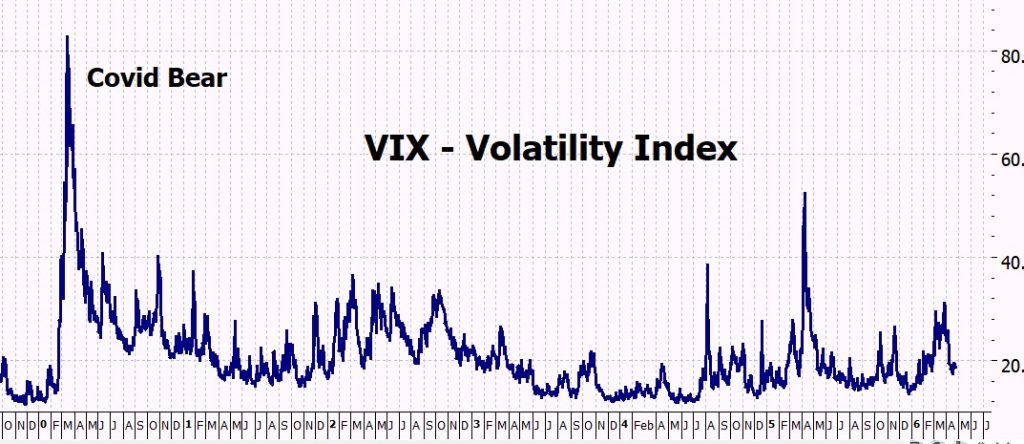
VIX Chart (Volatility)
Still low volatility.
ITMeter

The week ahead . . .
Monday 1 June
• US ISM Manufacturing PMI (May)
• Construction Spending
• Markets will be watching for signs that manufacturing activity is stabilising after a soft start to the year.
Tuesday 2 June
• JOLTS Job Openings (April)
• Factory Orders
• CrowdStrike earnings
• Job openings remain one of the Fed’s preferred measures of labour market strength. CrowdStrike will provide another read on cybersecurity spending, one of the strongest areas of corporate technology investment.
Wednesday 3 June
• ADP Private Payrolls (May)
• US ISM Services PMI (May)
• Dollar Tree earnings
• Services remain the largest part of the US economy, making this one of the week’s more important reports. Dollar Tree offers insight into lower-income consumer spending trends.
Thursday 4 June
• Initial Jobless Claims
• US Trade Balance
• Broadcom earnings
• Lululemon Athletica earnings
• Labour market data remains under close scrutiny as investors look for signs of either resilience or weakness. Broadcom will be watched closely for evidence that AI-related spending remains strong beyond Nvidia.
Friday 5 June
• Non-Farm Payrolls (May)
• Unemployment Rate
• Average Hourly Earnings
• The most important economic report of the month. Markets will be looking for clues on employment growth, wage pressures and the likely path of interest rates.
AI Watch
After Nvidia’s strong results last week, attention shifts to Broadcom. Investors will be looking for signs that demand for AI networking equipment and custom AI chips remains strong. The broader question facing the market remains unchanged: will the enormous AI infrastructure spending now underway ultimately generate sufficient returns to justify the capital being deployed?
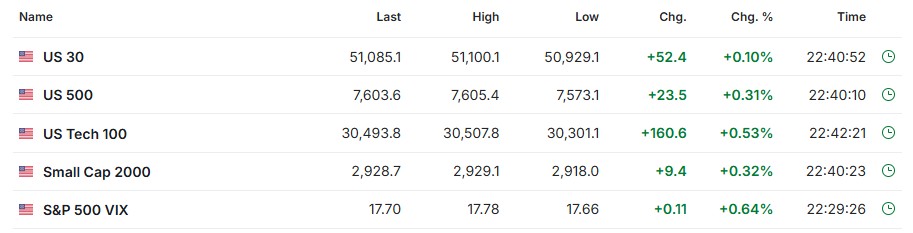
The futures
Looking rather jolly, but still 11 hours to market open.
What a week . .
I know that you don’t read this blog to find out what’s going on in my life, but indulge me this one. Last week I moved house, and as you know it is ranked among life’s top stressors, and exacerbated by not having a date for the new place to be ready.
Finally moved in, with lots of lovely big plants for my new ‘sky terrace’ – only to hit the worst storm for years, 2 days of damaging winds that have shredded all of my beautiful trees. Then, of course, the electricity went out. No PC, no internet. And how do you get out of a garage with an electric door?
This is by way of apologizing for my lack of answers to questions last week. I am sorry. I will do them in the next couple of days.
Today – the wind has died down, the sun is struggling through the clouds, the ocean looks remarkably calm . . . so life will soon be back to normal.

Sunset last night. Not exactly tropical.
Let’s hope it’s another great week!
Heather
Trade the tide – not the waves!


20 Responses
Hi Heather,
Any thoughts or concerns about applying ITM to the SMH (Semi Index)?
It appears to have a nice selection of options and great volume. I am concerned that it may not have enough diversification for ITM.
Curious what your take is.
Jeff
HI Jeff – actually I have some positions in SMH – some DITM, some OTM, and some straight shares.
Basically, I am very bullish on semiconductors / AI – as you’ve probably noticed. But its not part of the ITM strategy which relies on mass human emotions as seen in the major indexes.
So – its a side flutter – and until Friday was doing very well indeed!
h
Hi Heather,
Thank you for your response. Makes sense.
Jeff
Thank you Heather for taking the time to answer my question. It makes perfect sense now. I really appreciate it.
Glad it helped!
x
h
It looks to me like your models are set up to get assigned way too often. If setup to get assigned less frequently, they would benefit more often from upside, at least if you knew when to sell. Or would you sell as soon as the option expired? What did your model do with the underlying when their options were not assigned? It would be interesting to see what the results would be using deltas instead of percentages, picking deltas like maybe 0.1, 0.15, and 0.2 or 0.1, 0.2, and 0.3. It would also be interesting to see how accurately those deltas predicted assignment frequency. Jimbert
Hi Heather, if you want to enter with a DITM call option when it crosses above the 200-day SMA, what option duration do you choose? I would go with at least 6 months, but I usually notice a liquidity problem. Doesn’t an open interest of 100 pose too big of a risk that you won’t be able to sell the option anymore, or if you can, only at an unfavorable price? Thank you very much and best regards, Veio
Hi Heather, How do I buy your Latest Book (paper Back) ITM Bull& Bear A proven Strategy? I went to amazon and it stated it wasn’t available. regards Rom
How do I get the 10 day SMA and 200 day SMA on the SPY chart. All I see is the SMA option. Charlie
HI Charlie – if you scroll down the charts page you will see the instructions – use the moving average ribbon, (just click) – then you will see a small window on the top LHS that says ‘MA Ribbon’. Click on the three dots at the end and another window will open. In that you can change the parameters (called ‘inputs’) the colors, wieghts etc. To remove any extra SMAs just untick the boxes.
Hope this helps.
h
Hi Heather, I entered two QQQ DITM calls with a $400 strike in April 2026, expiring December 18, 2026. QQQ would need to reach $851 for my strike to drop to 47% and trigger the roll-up rule. That’s not going to happen before December expiration.
The book covers rolling up when the strike% threshold is hit, but my position is so deep ITM that the threshold can’t be reached before expiration. Is there a separate rule for rolling out for time when the strike% trigger mathematically can’t fire within the contract’s remaining life? And if so, when would you recommend doing that — and would you roll to the same strike or reprice to 50% of wherever QQQ is at that point?
Thanks,
Jason
Hi Jason,
Good question.
Before answering, can you clarify whether the $400 strike was entered as a 50% ITM trade or a 60% ITM trade?
If QQQ was around 650 when you entered, then a $400 strike would have been approximately 61.5% ITM, which means it falls under the 60% ITM rules. In that case the roll trigger would be 55%, not 47%.
A $400 strike reaches 55% when QQQ is approximately $727, so the roll point would be much closer than the $851 figure you calculated.
If, however, the trade was entered under the 50% ITM rules, then your calculation is correct and the 47% roll point would indeed be around $851.
Can you let me know roughly where QQQ was trading when you opened the position?
Heather
Hi Heather, QQQ was trading at approximately $663-666 when I entered on April 17 and 22, making the $400 strike approximately 60% ITM. So it sounds like I’m using the 60% model. At that rate you’re saying the roll trigger of 55% would fire at $727, and QQQ is already above that. Should I roll? We may be having a pull back so maybe i didn’t miss it!
Just out of curiosity, if I had done it at 50%, what would the scenario look like? How and when would you roll?
Thanks for your help,
Jason
HI Jason if you are entering today, the 60% is at $425 and the 50% is $355. Your strike is $400, or 57%.
Since you are trading the 60% it looks as though all is well – thanks to the large drop on Friday.
You don’t have to wait until 55% to roll up – if you were rolling out anyway you might as well roll up to 60% again.
The back testing has to have very defined rules – no room for human emotion – so it was doncuted strictly on the 55% rule. But you can roll up more frequesntly if it is convenient to you.
Hope this helps.
h
Hey Heather. Hope your move goes better in the future. I do have questions about your May 25 blog Selling Your Upside. I totally understand the bottom line that covered calls is a losing strategy particularly in a strong market. I am being a little dense but I don’t quite understand how you calculated the Upside Surrender and Premium Estimate over 156 weeks percentages in the tables. I know this is a trivial question, but it is bugging me that I don’t have it figured out. Thank you for all you do and all you have done for us.
Andy
Hi Andy,
Good question — and not trivial at all. In fact, I had to think quite hard about how to measure it.
The “Premium Estimate” is the easier of the two. I took the current option premiums for strikes 1%, 1.5% and 2% above the market (using options about a week from expiry), converted those to a percentage return, then multiplied by the 156 trading weeks in the study. It’s an estimate because premiums vary over time, but I deliberately used relatively generous premiums, so if anything it overstates the income received.
The “Upside Surrender” is the more interesting figure. For every week where the market closed above the strike, I calculated how much of the move was above the strike and therefore belonged to the option buyer rather than us.
For example, if SPY opened Monday at 100 and we sold a covered call with a strike 1% higher at 101, then SPY finished Friday at 104, we would keep the gain from 100 to 101, but the move from 101 to 104 would belong to the call buyer. We would therefore surrender 3% of upside that week.
I then added up all those surrendered percentages across the 156 weeks. The surprising result was that the cumulative upside surrendered was larger than the cumulative premiums collected.
One thing that is easy to misunderstand is that the 70% figure does NOT mean we gave up 70% of all market gains. It means that over the 156 weeks, the total amount surrendered in assigned weeks added up to 70 percentage points, while the estimated premiums collected added up to about 61 percentage points.
What surprised me was not that covered calls cap upside — we all know that. What surprised me was the magnitude. The premiums looked attractive until I compared them with what was being given away.
Hope that helps.
Heather
Hi Heather,
Have you considered doing your trend and channel analysis with logarithmic charts? Since your graphs are shown from 2020 on, which I really appreciate, and that valuations have more than doubled, I’m curious on how a logarithmic price axis would change your channels.
Thank you for all your insights!
HI Brent
Good question. Yes, I have looked at logarithmic charts from time to time, particularly when examining very long-term charts where prices have increased several-fold.
The difference is that a logarithmic chart measures percentage changes rather than dollar changes. On a normal chart, a move from 100 to 200 occupies the same vertical space as a move from 500 to 600. On a logarithmic chart, the 100% move from 100 to 200 is shown as much larger than the 20% move from 500 to 600.
For my purposes, I prefer arithmetic charts because the ITM signals are based on actual prices and moving averages, not percentage moves. The channels I draw are intended as a visual guide rather than a trading signal, so whether they are drawn on a logarithmic or arithmetic scale doesn’t change any trading decisions.
Having said that, if you go back several decades rather than just a few years, logarithmic charts probably give a fairer picture of the market’s long-term rate of growth. Over the period I normally show (roughly from 2020 onwards), the differences are noticeable but not large enough to affect the conclusions I draw from the charts.
Heather
Kinda like my schedule… I actually had to miss a cup of morning coffee Sunday. Anyway. Straight up without a healthy correction. With the summer months coming – nothing concrete with Iran. What about taking premium ( selectively not every occasional )?
R
HI Randy – twitchy fingers?
How will you decide when to take a premium?
You see, thats the problem . . .
x
h