


| The Weekly Income Illusion |
I was planning to move on to the other half of the wheel strategy, but there were so many questions and suggestions about covered calls that I thought I should clarify a few things first.
A frequent question was:
Why not use covered calls on our DITM options?
It seems logical on the surface. Because DITM options require much less capital than owning shares outright, the premium income looks enormous as a percentage return on capital.
Video
Podcast
But there’s a catch.
The upside you surrender becomes enormous too. Because leverage magnifies both gains and losses, the more leverage, the more painful the capped upside becomes during strong rallies.

The more you bet the more you give away!
As always, let’s analyze the actual figures.
Covered Calls Limit Your Upside
Let’s take a very simple example. Suppose every Monday morning at open we bought SPY and sold covered calls expiring that Friday – just 5 trading days later. I decided to back test it properly using the last 3 years of actual SPY data.
Is My Spreadsheet Broken?

The backtest results looked too extreme. In fact, I was so suspicious of the results that I ran the spreadsheet through two separate AI models to check formulae, assumptions and logic. Both said the same thing:
The calculations were correct.
The Startling Truth
At first glance the results seem impossible. How can a strategy that “collects income every week” end up giving away more upside than it receives in premiums?
The Covered Calls Secret
(that no-one talks about)
The answer lies in how market gains actually occur. Most weeks are relatively small, but a surprisingly large portion of long-term market returns comes from sudden sharp rallies.
Covered calls cap those rallies. You keep the small premium, but once the market rises beyond the strike, the extra gains belong to someone else.
Not You!
You’ve sold them away.

Three Year Backtest
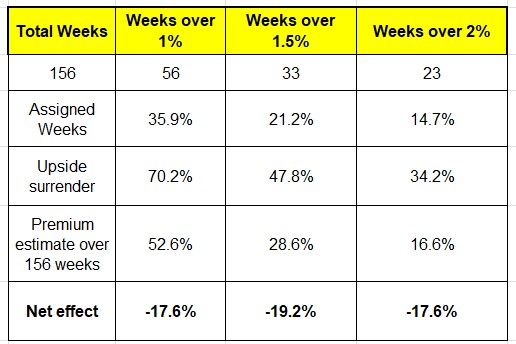
Over the last 3 years there were 156 trading weeks. I tested what would have happened if, every Monday morning at open, we sold calls expiring Friday with strikes 1%, 1.5% and 2% above the current price. (actual options prices were on Thu 21 May before market open for expiry Thu 28 May I deliberately used option premiums 7 days to expiry to include the weekend, which will over-estimate the premiums received. Real-world results would likely be even worse.)
Being Assigned
First we have to check how often we would be assigned (our shares called away). It is surprisingly high.
- 1% above: assigned 36% of the time
- 1.5% above: assigned 21% of the time
- 2% above: assigned 15% of the time
And remember: when assignment occurs, every gain above the strike price belongs to somebody else. Not you. The premiums we keep, whatever happens. But what are we giving up? The table tells the whole story.
What upside are we giving up?

That is the point. We are giving up much more than we are earning. For the +1% strike the cumulative upside surrendered was over 70%, more than the premiums collected. In other words, the strategy:
gave away more upside than it earned in income.
As the strike moves further away, assignment becomes less frequent – but the premiums collapse as well. At +2%, assignment frequency falls to 14.7%, but annualized premium income drops to levels barely above ordinary market returns.
Why Do People Like Covered Calls?
This does not mean covered calls “never work.” In flat or slowly rising markets they can produce steady income and feel psychologically rewarding because most trades appear successful. You collect small amounts regularly and the strategy feels calm and controlled.
The problem appears during strong bull runs.

The very rallies that create long-term wealth are repeatedly capped, sliced off, and handed to somebody else.
The Trade Off
That is the hidden trade-off behind covered calls: small frequent income in exchange for sacrificing part of the market’s biggest gains.
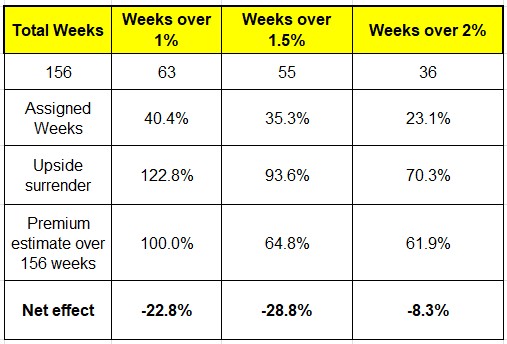
What about QQQ?
I will let the results speak for themselves:
But . . what about stocks?
Ironically, even many examples used by covered-call educators demonstrate the very problem they are trying to avoid: the best gains are repeatedly capped. Heitkoetter frequently uses AAPL and TSLA, so let’s look at these.
AAPL Covered Calls
AAPL strikes do not have the granularity of SPY and QQQ, so it was not possible to check the 1.5% above, only the 1% and 2%. The results are startling:
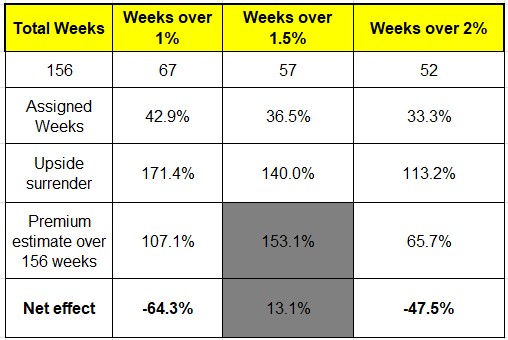
That’s right – you can underperform buy-and-hold by around 20% a year doing covered calls on AAPL. And pay a LOT for the right to lose money. But first let’s check TSLA.
TSLA Covered Calls
You thought AAPL was bad? Hold onto your hat!
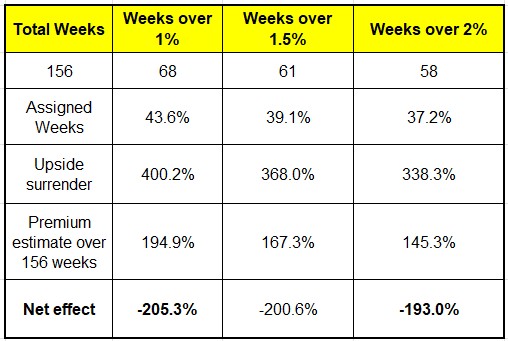
That’s right: by doing covered calls you are underperforming a simple buy-and-hold by around 70% a year.
Why would you do it?
Even more relevant – why would you PAY someone to tell you how to underperform the market?? But people do. And they pay a LOT! Heitkoetter cites 300,000 people doing his strategy.
Here’s what it costs (from the European Financial Review):
- PowerX Optimizer software: around US$3,997 one-off.
- Platinum coaching: around US$13,000 for 6 months.
- Diamond coaching: around US$30,000 for 12 months
Not only that , there are add-ons:
- masterminds,
- live strategy sessions,
- Wheel strategy training,
- memberships/community access, and
- trading education built around “weekly paychecks” from options selling.
And People Pay . . .
He explicitly promotes annualized premium calculations, “weekly paychecks,” and assignment rates. In his own material he says the scanner looks for: “annualized premium rate above 30%”

That sounds great . . . but what happens after accounting for the upside surrendered during assignment? The tables above tell the real story.
Most Active Traders Lose Money
Is it any wonder they crash & burn? Following strategies like this? What is never mentioned is the hidden cost of forgoing your upside.
Doing worse than buy-and-hold? That takes some doing!
But – you have to admire someone who can get 300,000 people to pay $30k a year for such a strategy.

To the markets . .
A nice week, but no new highs. Nvidia earnings once again dominated attention, with revenue and guidance continuing to surge on relentless AI demand. But the focus is gradually broadening beyond Nvidia itself, with traders increasingly watching the wider AI ecosystem – infrastructure spending, power demand, data centers, networking, software integration and whether the rest of corporate America can ultimately turn the AI boom into sustained profits.
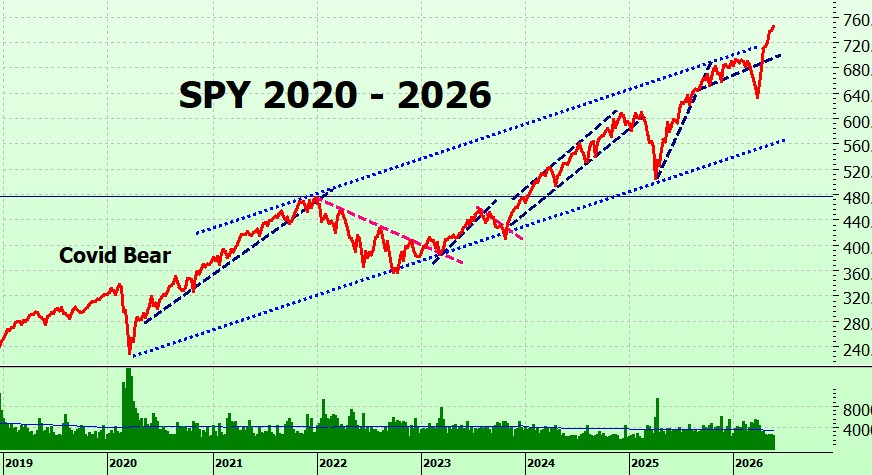
SPY Charts
Two down days, three up days, not quite back to last week’s high – showing more of a consolidation pattern.
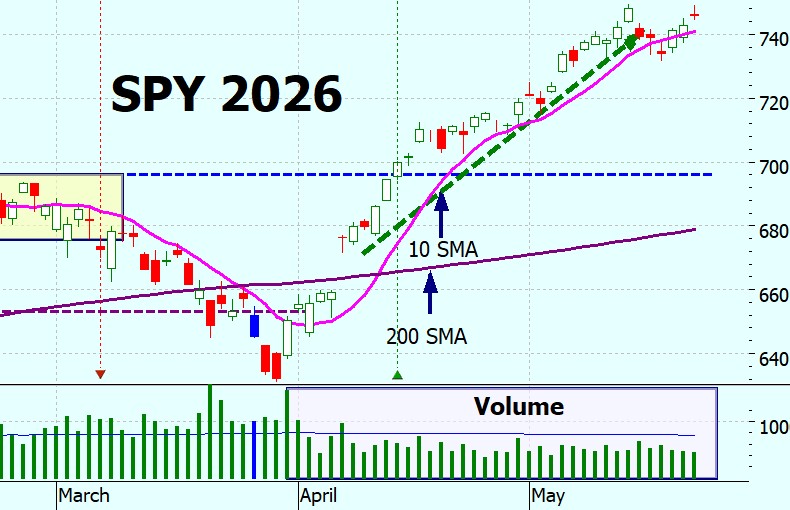
Still heading north out of the trading channel.
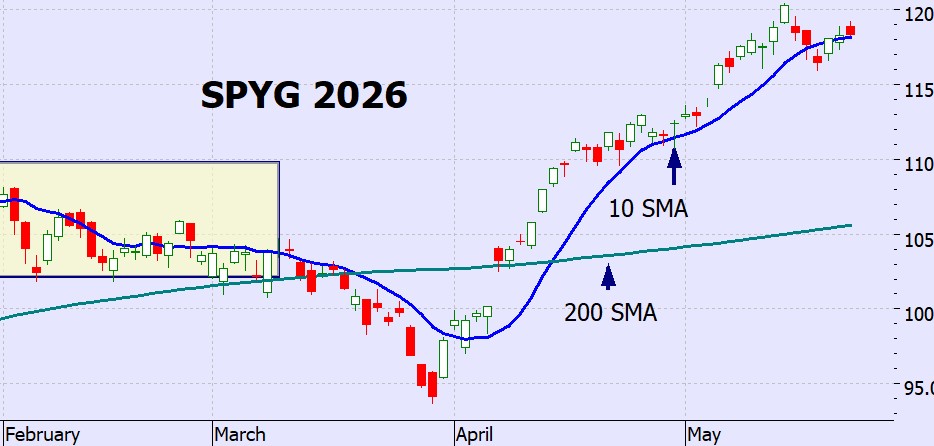
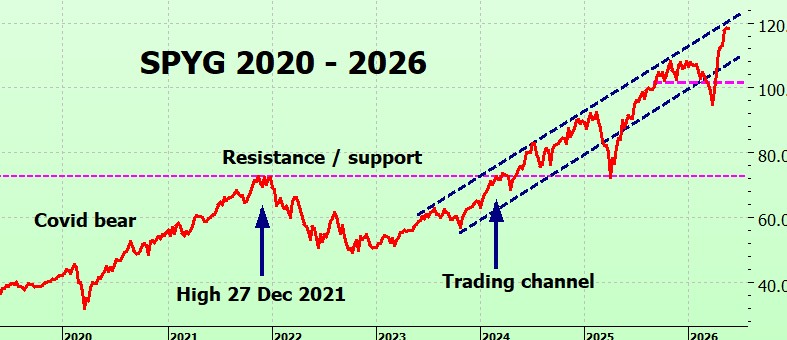
SPYG Charts
SPYG finished the week roughly where it started. No new highs.
The long term chart shows it still bouncing off the upper bound of the trading channel.
QQQ Charts
QQQ almost but not quite made a new high. Also showing consolidation.
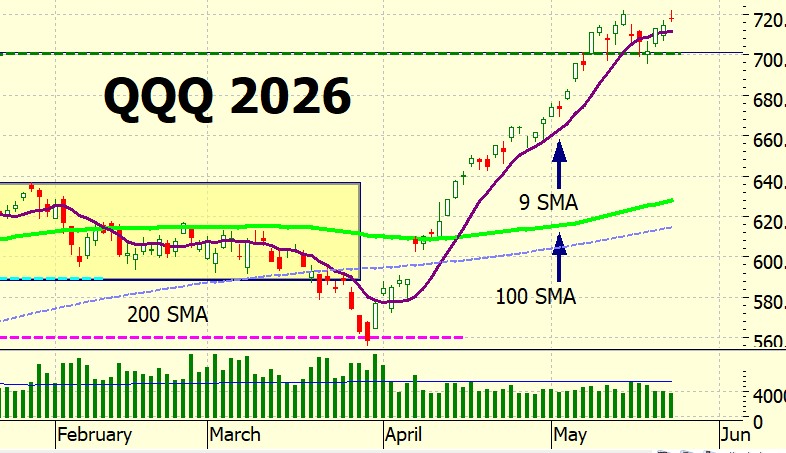
Long term it is staying above the trading channel, but starting to consolidate.

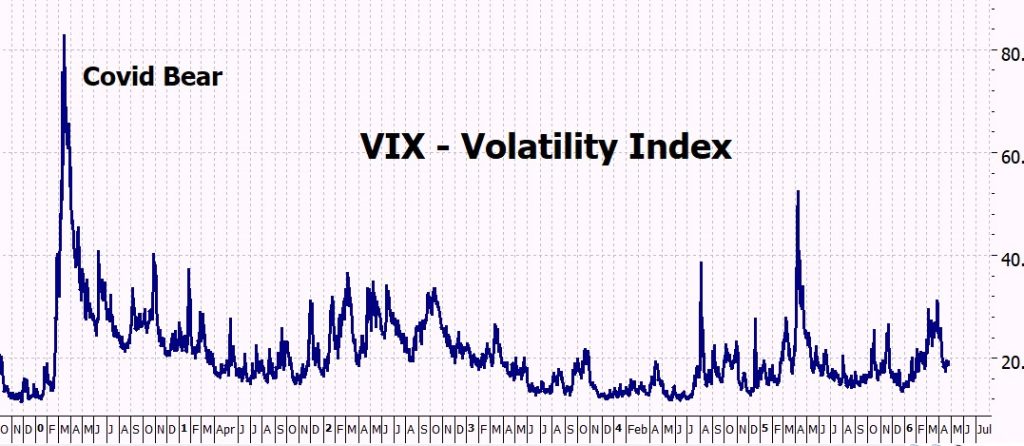
VIX Chart (Volatility)
Vix back in low volatility territory.
ITMeter

The week ahead . .
Likely to be quieter early in the week due to the U.S. Memorial Day holiday on Monday, but inflation and growth data later in the week could still move markets. AI spending, bond yields and consumer strength remain key themes – and, of course, the situation in the Middle East.
Monday – May 25
• U.S. markets closed for Memorial Day.
• No major economic releases.
• Earnings: none major.
Tuesday – May 26
• Consumer Confidence.
• S&P/Case-Shiller Home Price Index.
• Earnings: AutoZone, Box, Zscaler.
Wednesday – May 27
• Richmond Fed Manufacturing Index.
• Earnings: Salesforce, HP, Abercrombie & Fitch.
Thursday – May 28
• Core PCE Inflation — the Fed’s preferred inflation measure.
• GDP (second estimate Q1).
• Durable Goods Orders.
• Personal Income & Spending.
• Weekly Jobless Claims.
• New Home Sales.
• Earnings: Costco, Dell, Autodesk, MongoDB, Marvell.
Friday – May 29
• Chicago PMI.
• Wholesale Inventories.
• Earnings: Buckle.
Key themes this week:
• Inflation remains front and center with Core PCE on Thursday.
• Bond yields continue to pressure valuations, especially tech.
• AI infrastructure spending remains dominant after Nvidia’s strong earnings.
• Dell and Marvell may provide further insight into AI server and hardware demand.
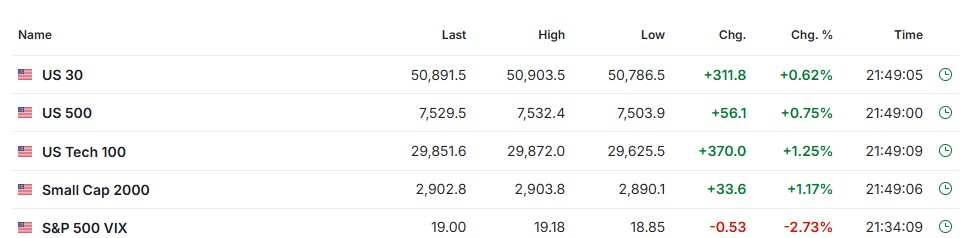
The Futures
Monday is a NYSE holiday, but the futures are open and pointing to a good day Tuesday.
Next Week
We’ll get further into The Wheel Strategy, including looking at it in the context of the evolving options market.
Let’s hope for a brilliant week!
Heather
Trade the tide not the waves
Q & A
Related Posts
- Selling Naked Puts
The unexpected happens. And, boy, didn’t it happen last Monday! When I wrote the blog,…


29 Responses
Hi Heather, I entered two QQQ DITM calls with a $400 strike in April 2026, expiring December 18, 2026. QQQ would need to reach $851 for my strike to drop to 47% and trigger the roll-up rule. That’s not going to happen before December expiration.
The book covers rolling up when the strike% threshold is hit, but my position is so deep ITM that the threshold can’t be reached before expiration. Is there a separate rule for rolling out for time when the strike% trigger mathematically can’t fire within the contract’s remaining life? And if so, when would you recommend doing that — and would you roll to the same strike or reprice to 50% of wherever QQQ is at that point?
Thanks,
Jason
HI Jason – I will move this to this weeks blog so that others have a better chance of seeing it.
x
h
Heather:
Three years of back testing on the 5-7 day Jade Lizard can be found here: https://www.youtube.com/watch?v=zBoN10v9-zk
Certainly not as complete as your backtesting, but interesting nonetheless, and it explains some of the mechanics. I take profits at 25-30%, thus trades usually run 2-3 days. I open a new trade as soon as I close one. Sometimes I have two running.
I like the Jade Lizard, but my largest individual trades are in ITM trades (SPY, SPYG, QQQ), thanks to your clever strategy and excellent write-up.
Richard
HI Richard – thank you – haven’t had time yet to look at it – brand new appartment and appliances / none of them working!!
I will definitely have a look once my head is above water.
x
h
QQQ trading channel is duplicate of SPYG.
Probably lots of people saw it but since you wondered on another week if anyone notices these things, somebody does.
Thanks Bob!!
Yes, I often wonder, so it’s nice to know!
x
h
Heather, Heather. You’ve done it again. I am one of those sellers of short calls, saying “Why leave that cash just lying there? Might as well pick it up along the way.” BUT, I’ve really come to appreciate the calm and steady growth of the DITM strategy. In this strong bull run, Its a race to roll the short call strikes up and expirations out to avoid assignment. Of course this results in greater liability against the lovely gains of the long calls. Now Im just waiting for a dip so I can buy to close my shorts losing as little as possible.
HI David – yes, it is sooo tempting, but it just doesn’t work.
Although it is a brilliant strategy for getting people hooked on frequent small gains.
Psychology was myminor at uni – it was many years ago and we each had a rat to train. It pressed a lever to get a (very small) drink of water, and then only when the red light was on – and something else I can’t remember.
But it was extinguishing the behavior that always stuck with me – intermittent reinforcement made it almost impossible.
Which is why we get addicted to weeklies!
x
h
Heitkoetter doesn’t have a great reputation and probably isn’t the best. He’s lost a lawsuit over his trading courses. Low Stress Trading (https://lowstresstrading.com/options) has a much better reputation on places like Trustpilot and a different approach, I think.
Hey!
I didn’t know about the lawsuit – must check. and I will have a look at Low Stress Trading once I have finished unpacking hundreds of boxes!
(how on earht did I get all this STUFF????)
x
h
It looks to me like your models are set up to get assigned way too often. If setup to get assigned less frequently, they would benefit more often from upside, at least if you knew when to sell. Or would you sell as soon as the option expired? What did your model do with the underlying when their options were not assigned? It would be interesting to see what the results would be using deltas instead of percentages, picking deltas like maybe 0.1, 0.15, and 0.2 or 0.1, 0.2, and 0.3. It would also be interesting to see how accurately those deltas predicted assignment frequency.
HI Jimbert – have moved this to the current blog so that other people can read it too.
x
h
In essence … the covered call is selling premium against the 100 shares of stock you own. So… if you own one option of SPY and decide to sell premium on it it’s called a long diagonal. Or a poor man’s covered call. And essentially ppl don’t tell you it’s a losing proposition in the long run? Correct?
R
Hi R,
Yes, that’s essentially what a Poor Man’s Covered Call (PMCC) or long diagonal is.
Instead of owning 100 shares, you own a deep ITM call and then sell shorter-dated calls against it. The attraction is obvious: much less capital is required, so the premiums collected look enormous as a percentage of the money invested.
The problem is exactly the same as with ordinary covered calls.
You are still selling away your upside.
In fact, because the position is leveraged, the upside you surrender can be even more significant. The premium income looks larger because the capital outlay is smaller, but the underlying trade-off hasn’t changed. You are exchanging potentially large future gains for smaller, more immediate premiums.
Does that mean every PMCC loses money? No. Just like covered calls, they can work perfectly well in flat or slowly rising markets. The problem appears during strong rallies. That’s when the short call caps your gains and the long call cannot fully participate in the move.
What surprised me when I ran the covered-call numbers was not that upside was being given away — everyone knows that. It was the magnitude. The cumulative upside surrendered over time was larger than the cumulative premiums collected.
A PMCC simply applies the same idea to a leveraged position.
Heather
Great work per usual Heather. I think to really analyze the results you would need tests through a variety of market scenarios – bull (done), bear, and sideways. Perhaps a rolling 3 or 5 year period over the past 20 years or so. Of course I’m not asking you to do this. Just commenting that the strategy looks worse during the strong bull market like we’ve had in the past 3 years.
Hi Thor,
I completely agree.
Covered calls perform best in flat or slowly rising markets and worst in strong bull markets. The last three years have certainly not been ideal conditions for the strategy.
The question I would ask, though, is: what market are we actually in most of the time?
The market spends the majority of its life in long-term uptrends. There are periods of consolidation and sideways movement within those trends — for example from October last year until March — where covered calls may well add value. The problem is that we never know in advance when the next leg higher is about to begin.
Looking back, it’s easy to identify periods where covered calls would have worked beautifully. Looking forward, we’re all staring at the right-hand side of the chart and making decisions without that knowledge.
For me, the real test of a strategy isn’t whether it performs well under a specific set of market conditions. It’s whether I can identify those conditions in real time and switch strategies before the market changes.
That’s the part most analyses leave out.
h
I noticed that in my options trading with the weekly strategy. I got tired of assignments and buying back shares at a higher price. I became more successful when when buying strikes at 5% expiring in three months. Rolled every two to two and a half months.
Hi Todd. I’m interested in learning more on this. Do you have any strategies for doing this? Do you have multiple call options running with different expiration dates? What do you do when the market dips like it did in March? If you weren’t careful, you could lose your whole portfolio.
HI Charity – I am not sure that Todd will see this as I have been so lax in answering questions!
Maybe you could post in this week’s blog? and suggest that you open an ITM Chat thread?
x
h
Hey Todd
Interesting observation.
What you’ve really done is move the strike further away from the current price, which naturally reduces the number of assignments. That makes perfect sense.
The question I would ask, though, is whether the reduction in assignments outweighs the reduction in premium income.
A strike 5% above the current price sounds comfortably out of reach, but it also means you are capping your gains. If you do that repeatedly through the year, you’re effectively saying, “I’m happy to give away anything above roughly 20% per year.”
That sounds reasonable until you look at what actually drives long-term returns. QQQ has gained more than 50% in a year, AAPL more than 80%, TSLA more than 700%, and NVDA more than 200% in individual years. Those are exactly the years that create most of the wealth.
So I think the real question isn’t whether 5% works better than 1% or 2%. It probably does.
The real question is: how do we know in advance when the market is going to be quiet enough that selling away our upside makes sense?
If the market spends the next year moving sideways, covered calls may work very well. If it spends the next year rallying strongly, we may regret having sold away those gains.
That’s always the challenge. Looking back, it’s easy to see which strategy would have worked best. Looking forward, we’re all standing at the right-hand side of the chart.
h
Thanks for your analysis. I have always been skeptical of making money using covered calls. The market conditions under which you actually come out ahead are very limited.
Hey Warren,
Exactly.
It’s easy to point to periods where covered calls work well, and just as easy to point to periods where they don’t.
The real challenge is recognising what market we’re in now and choosing the strategy that will work going forward. Looking back, we can all find strategies that would have been perfect. Looking forward, we’re standing at the right-hand side of the chart.
My concern with covered calls is that they perform worst in strong bull markets — and those are precisely the periods that generate most of our long-term gains.
h
Good blog as usual. I don’t know how you do it every week! Your bottom line that covered calls and similar strategies for a selling premium like Iron Condors only work in flat or relatively calm markets is certainly true. So why not use indicators that tell you when the market is likely to be favorable for the strategy to work. I use a combination of Bollinger Bands, RSI and ADX which together eliminate or filter out about half the trading days as unsuitable. The rest of the time the strategy runs favorably for the vast majority of the trades.
Great insights, Dave! I follow a very similar philosophy, though my operational toolkit is tuned slightly differently. I always say the ADX doesn’t just sit around making tea with the RSI—and it certainly doesn’t when you bring the MACD into the mix. Together, they have a brilliant synergy under the hood.
In my system, I use those three indicators to focus heavily on identifying structural divergences. Adding that divergence layer as an early warning system gives me the exact same clean filters and excellent results you are experiencing.
The real game-changer for me, is that I use an AI assistant to handle this. I fed my entire system rules—covering the SMA crosses, ADX strength, and MACD/RSI divergences—into the AI. On Sunday, I fed a very simple prompt with the current chart data. The AI strips out all emotion, runs the checklist, and catches those structural shifts instantly. It makes maintaining strict indicator discipline simple. Thomas
Hi,
Good point.
If you can reliably identify periods of low volatility and sideways markets, then covered calls and premium-selling strategies should certainly perform better. That’s exactly the environment they were designed for.
My question is always the same: how confident are we that those indicators are identifying the future rather than describing the present?
Markets can go from calm to explosive very quickly. Bollinger Bands, RSI and ADX may filter out some unsuitable trades, but they also add another layer of decisions, judgement and complexity.
Personally, I prefer simple rules that I know work over long periods. The more filters we add, the greater the risk of curve-fitting our strategy to past data and convincing ourselves we can predict which environment comes next.
Of course, if your approach genuinely improves returns over a full market cycle, then that’s all that matters.
For me, the challenge is always the same: we’re all standing at the right-hand side of the chart.
h
Heather
I agree with Lowell and I have been using LEAPS (currently using January 2028) and selling 30 day CC against the LEAP. Always sell the CC above the cost of the LEAP. Seems to be working just fine for me. Slow and easy…
Phillip
Hi Phillip,
If it’s working for you, that’s all that matters.
What you’re describing is essentially a Poor Man’s Covered Call — using a LEAP as a substitute for the shares and then selling shorter-dated calls against it.
The attraction is obvious. The LEAP reduces the capital required and the monthly premiums provide a steady stream of income.
My only observation would be that the trade-off hasn’t disappeared. You’re still selling away part of your future upside. In fact, because you’re using options rather than shares, you may also be giving up some of the leverage that made the LEAP attractive in the first place.
The key question isn’t whether the strategy makes money. Most covered-call strategies make money much of the time. The question is whether it makes more money than simply holding the LEAP without repeatedly selling away the upside.
That’s the part I was trying to quantify in the blog. The premium income is obvious because it arrives every month. The opportunity cost is much harder to see because it’s spread across the occasional strong rallies that get capped.
As always, there are many ways to make money in the market. My preference is to keep as much of the upside as possible when the market decides to run.
h
Another great blog, heather, but to be complete, mightn’t you next compare short duration v LEAP covering calls? selling short terms calls v shares is probably a coin flip,. Smoothing things out by selling a significant dollar amount of extrinsic value in a LEAP cc is a different and perhaps backtestedly better flip?
Hi Lowell!
Sorry for late response.
Thank you — and that’s a fair point.
The question I’d ask is whether changing the duration of the option changes the underlying trade-off, or simply changes its timing.
A longer-dated call contains more extrinsic value than a short-dated call, so there is certainly more premium available to collect. At the same time, the buyer is purchasing a longer period of upside, which means we are potentially giving away more future gains.
What surprised me with the covered-call analysis wasn’t that upside was being surrendered — everyone knows that. It was the magnitude. The premiums looked attractive until I compared them with what was being given away.
My suspicion is that the answer depends less on whether the option is short-dated or a LEAP, and more on the relationship between the premium received and the upside surrendered.
That’s something that could certainly be tested.
You may have just given me another spreadsheet project!
h