Most people assume that QQQ is the Nasdaq. It isn’t.
Nasdaq: the stock exchange
Nasdaq Composite: almost every stock listed on that exchange (3,000+ companies)
Nasdaq 100: the largest non-financial companies
QQQ: an ETF that tracks the Nasdaq-100
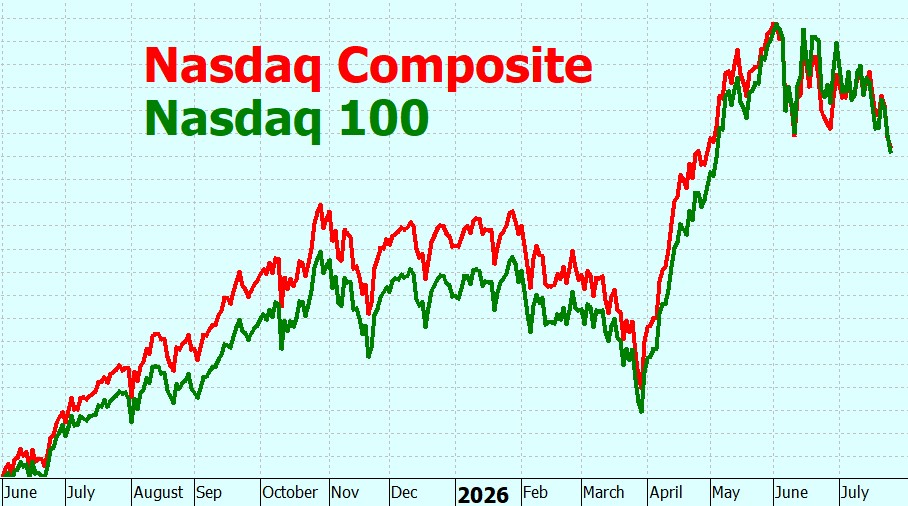
Nasdaq Composite V Nasdaq 100
The Nasdaq Composite has over 3,000 companies, and includes regional banks and financial services. Approx USD $38 trillion market value.
The Nasdaq 100 has 100 companies, and strictly excludes financial institutions. Approx USD $32 trillion Market value.
Divergence
While the indexes frequently move together they can diverge. Suppose regional banks rise strongly after good earnings while Nvidia, Microsoft and Apple all fall slightly.
The Nasdaq Composite contains those banks, so it may finish higher overall.
The Nasdaq-100 excludes financial companies altogether and is dominated by the mega-cap technology stocks.
The result? The Composite finishes up while QQQ finishes down.
Techs Dominate
Why? Because of the market-cap weighting. Although the Nasdaq composite has around 2,900 more companies than the 100, the market caps are not much different.
Those 2,900 companies only account for approximately 15% of the exchange’s value.
In other words, the big tech companies dominate both indexes.
Capped or uncapped?
Indexes can be either capped or uncapped. The difference is in the limits on how much influence a single company is allowed to have on an index or ETF.
Capped Market Cap
A capped market cap index starts with traditional market-cap weighting but applies a strict ceiling to limit individual stock weights. When a stock’s weight breaches the cap threshold (e.g., 8%, 10%, or 20%), the index methodology “trims” the excess percentage and redistributes it proportionally across the smaller, uncapped components.
For example if the cap was 10% and, say, NVDA grew to 25% then the index forces it back to 10%.
Uncapped Market Cap
In an uncapped market cap weighted index, a company’s percentage weight is calculated purely by its size.
For example, if NVDA grew to represent 25% of the total market value then it would be 25% of the index.
What about the Nasdaq Composite?
This is a pure market-cap weighting. Stocks grow purely based on valuations. For example, If Apple grows twice as large it’s weighting naturally doubles. There are no caps on how much of the index it can take up.
The composite reflects the market almost exactly as it is.
The Nasdaq-100?
This does not allow the biggest companies to dominate. Every quarter the index is rebalanced using ‘Modified Market Capitalization Weighting’ where the index is forced to redistribute the ‘excess weight’. Funds tracking the index must then adjust their holdings accordingly.
The effective date this happens is before the market opens on the first trading day after the third Friday of March, June, September and December.
No company’s weight can exceed 24%, and the aggregate weight of all stocks with weights greater than 4.5% cannot exceed 48% of the total.
What happens when it does? The weighting is stripped off these winners, and redistributed to the smaller companies in the index.
The Takeaway?
Both indexes are driven by market capitalisation. The difference isn’t that one ignores the largest companies – it doesn’t. The Nasdaq-100 simply prevents them becoming quite as dominant as they otherwise would be.
Most investors spend their time trying to predict the market.
Very few spend time understanding the instrument they are investing in.
What about other tech indexes?
Next week we’ll stay with technology – but this time we’ll look inside it. Semiconductor indexes, software indexes, internet indexes and infrastructure indexes can behave very differently, even though they’re all labelled “technology”.
To the markets . . .
Not a very nice week – although I think the headlines about it being a technology bear market were a little exaggerated. We are some way off that happening. Mainly they were referring to SOXX (iShares Semiconductor ETF) which reached 655 in June and then dipped to 522 which is technically a bear market – but only for the stocks in that index, not the general Nasdaq Composite or Nasdaq 100.
But, hey, it made a good headline, didn’t it? The Vaneck Semiconductor ETF (SMH) followed the same pattern but didn’t quite make it into bear territory.
But more of the other tech indexes next week.
SPY Charts
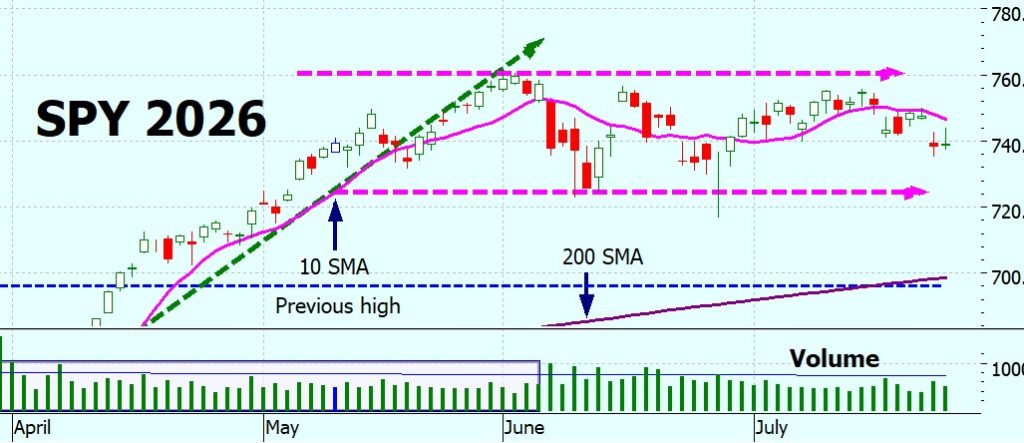
The chart doesn’t look particularly horrible – it is slap-bang in the middle of the sideways trading range. The doji candlesticks show that there’s not much conviction among traders about which way the market is going. The volume – or lack of it – confirms it. We are still over 40 points away from a death cross, so at the moment there is no sign that we should be getting out.
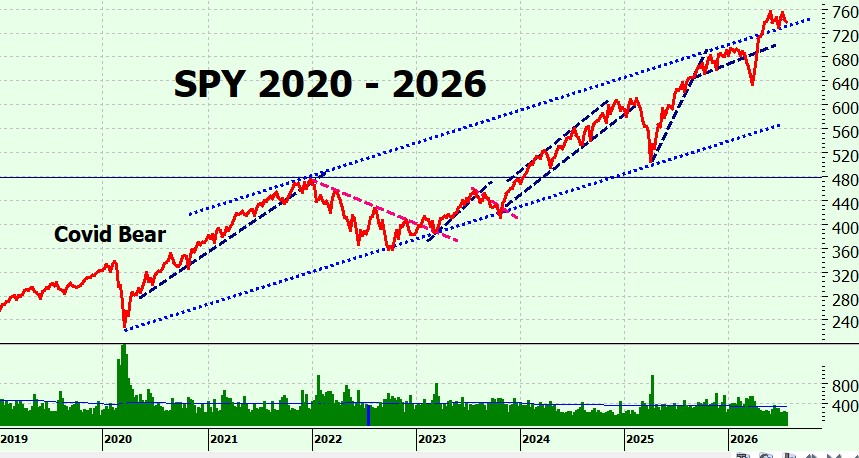
The long term chart supports this observation – SPY is returning to the upper bound of the trading channel.
SPYG Charts
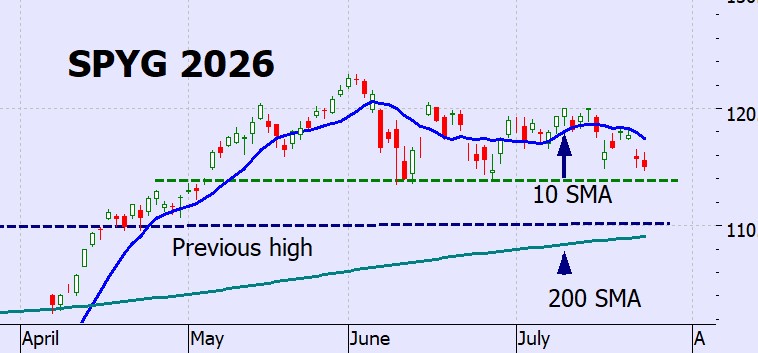
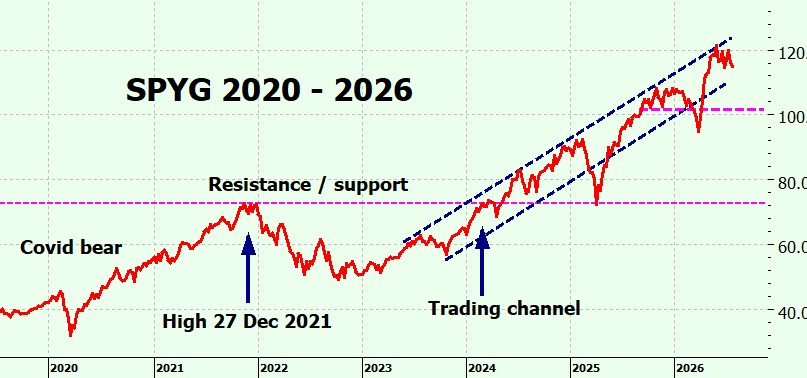
SPYG is showing the same pattern – sideways and holding up above support.
Long term it is right in the middle of the trading range. I have to draw attention to how accurate this line has been – we drew it in almost 2 years ago – and every time it has reached it, it has rebounded. It is almost spooky how it does that.
(Of course it wouldn’t do it for ever. At some stage it is going to break out – we just don’t know when and which way.)
QQQ Charts
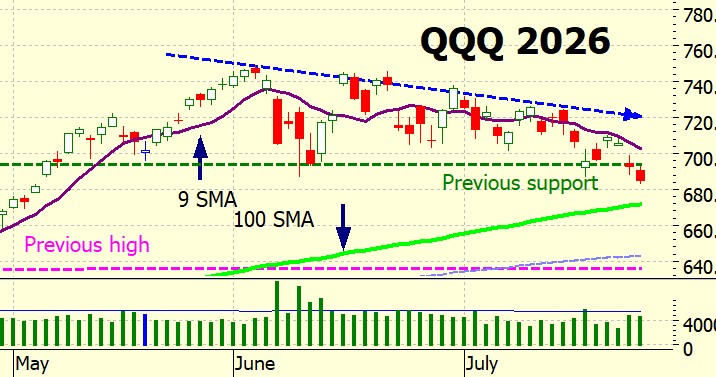
QQQ isn’t quite as reassuring. It has failed to make a new high since early June, and now it has dropped through support. The 9-day SMA has been heading down and is now only about 30 points above the 100 SMA. Possible death cross coming up – but, of course, we don’t jump the gun, we wait until it has happened and been confirmed.
On the long term chart it is back in its trading channel, right in the middle.
VIX Chart (Volatility)
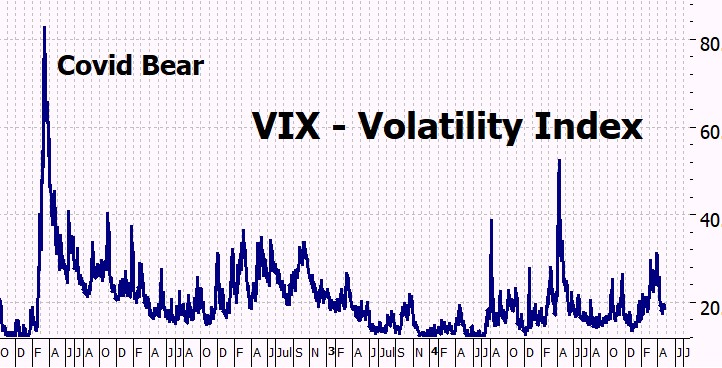
The VIX is still not really worried – I think I should maybe do a blog on it – how it is made and how to read it. If you think this a good idea let me know in the comments below.
ITMeter
The week ahead . . .
This week’s focus shifts to the Federal Reserve’s interest-rate decision, a heavy round of Big Tech earnings later in the week, and several important economic reports. Investors will be watching closely for any change in the Fed’s outlook, while results from Apple, Microsoft, Meta and Amazon could have a significant impact on the technology sector and the broader market.
Monday
Reports: Durable Goods Orders
Earnings: Waste Management, Welltower, Cadence Design Systems
Reports: Employment Cost Index, Chicago PMI, University of Michigan Consumer Sentiment
Earnings: Exxon Mobil, Chevron, Colgate-Palmolive
The futures
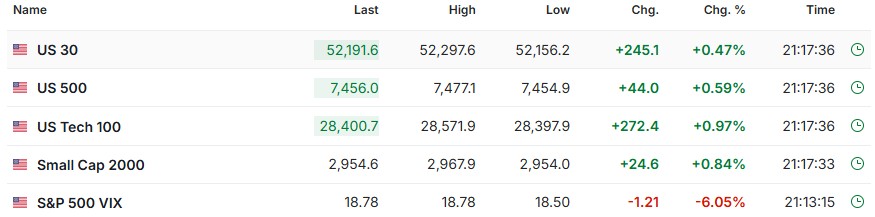
Right now, they are looking positive, probably affected by the drop in the oil price – but it is still 12 hours to market open, and we have recently noted that they tend to bounce around a lot and don’t really give us any reliable direction.
Let’s hope it is a better week than the last two – I am fed up avoiding looking at my accounts! But there doesn’t seem to be an imminent ITM OUT signal – but if it happens I will send a special email and do a special blog post.
Heather
Trade the tide, not the waves
Q & A
13 Responses
I would like to see the VIX explained. I too am tired of not being able to look at my account. In SPY, QQQ, SPYG. Great job calming my nerves, concerned on QQQ. But going to ride the tide. Question do you immediately get out if a dead cross happens, or do you wait to see if it holds for a day or two.
Thanks
Robin
Hello Heather —
just finished your book and stepping into the ITM strategy and wondered if I could get clarity on a few things.
• When do you take profits? If I’m wanting to supplement my income with this strategy, I wasn’t quite clear on what that looked like and if there was a process there and how this correlated with the rolling of the options.
• Am I looking at the crosses on the DAILY or MONTHLY timeframe when looking for signals to get in and out?
• If there is a good gap, I’m assuming I’m ok to get into the Bull strategy in the SPYG as of today, but as soon as it crosses I get out and wait for it to cross again — I believe the book said to get in the next day when the signal hits, so I may be answering my own question here with needing to view the signals on the daily.
Appreciate your insights and wisdom here Heather!
Hope you are mending. I am enjoying the mind shift that comes from waiting for a signal rather than guessing the future.
May I suggest a post on “Trump accounts”, now children can invest in a tax deferred account- but only in the S&P 500. Until they are 18 then it can roll to IRA . So additional passive buying of the index, cannot even hold cash… i am thinking the index will be affected over time as more and more buying pressure from retirement indexing, and now this.
Hi Heather,
Please keep doing what you do. We are all grateful! I’ve been reading the books and following the books for over two years. I do not know of any other author that compares to your books or your blog… I always admire the way you back up your statements or thoughts with actual data. Imagine that!! Leveraging the charts with IN/OUT signals tied to human behavior is genius. Now, when I occasionally turn on CNBC, I just laugh at the commentary.
Keep up the excellent work and know that we appreciate the time you put into all of this!
Jeff
Hi Heather,
I just recently got your book as a recommendation and ordered it right away. I am in my 30s so I have enough time to build wealth so I thought I should give this strategy a try.
For now I opened one SPY 50% and one QQQ 60% DITM Call. As always I tend to start a new strategy at the worst time so both positions are down already. I will stick to the rule and not act on emotions.
Looking forward to learn and stay in touch with you and the community around the strategy.
Best regards from Germany
Philipp
Vix – yes. / crystal ball – yes too ( wouldn’t that be nice ). I find it amazing that the markets rely on news to make their dramatic jumps one way or another. And that successful launch of SpaceX rocket does absolutely nothing for the stock… R
Hey Randy – yes, would love a crystal ball – that worked!
And Space X – I haven’t really checked out its effect on the tech indexes – I’ll add it to the list of things needing investigation!
h
Amazing work Heather!! Been following books and blogs for couple of years and always learning from you. Thank you!!!
Hi VE (?)
Thank hyou for your kind words, glad you have found them useful.
h
Hi heather,
Want to thank you for your passionate giving of yourself and your knowledge to all your readers and followers, such as myself.
I would like you to do a blog on the vix and if you could do one in the future on the different types of candles, Doji, hammer, engulfing etc. and how volume works with them I would be very thankful.
Hope your healing and are like new again, Jim
Hi Jim – thank you! I sometimes wonder why I do it – especially when someone has asked ‘what’s your angle?’ – but getting comments like this makes it worthwhile.
Re candles – yes I will put that one the BLOG list as they are interesting – my position is that they help us understand what is happening in the market, but they are nnot reliable enough to trade from.
But yes, good idea – will do a blog on that.
h
Thanks again Heather, another insightful read. Yes, an explanation of the VIX would be great and I look forward to it.
Cheers,
Richard.
HI Richard – I’ll finish off the tech indexes next week then do the Vix the week after.
h


































13 Responses
I would like to see the VIX explained. I too am tired of not being able to look at my account. In SPY, QQQ, SPYG. Great job calming my nerves, concerned on QQQ. But going to ride the tide. Question do you immediately get out if a dead cross happens, or do you wait to see if it holds for a day or two.
Thanks
Robin
Hello Heather —
just finished your book and stepping into the ITM strategy and wondered if I could get clarity on a few things.
• When do you take profits? If I’m wanting to supplement my income with this strategy, I wasn’t quite clear on what that looked like and if there was a process there and how this correlated with the rolling of the options.
• Am I looking at the crosses on the DAILY or MONTHLY timeframe when looking for signals to get in and out?
• If there is a good gap, I’m assuming I’m ok to get into the Bull strategy in the SPYG as of today, but as soon as it crosses I get out and wait for it to cross again — I believe the book said to get in the next day when the signal hits, so I may be answering my own question here with needing to view the signals on the daily.
Appreciate your insights and wisdom here Heather!
Hope you are mending. I am enjoying the mind shift that comes from waiting for a signal rather than guessing the future.
May I suggest a post on “Trump accounts”, now children can invest in a tax deferred account- but only in the S&P 500. Until they are 18 then it can roll to IRA . So additional passive buying of the index, cannot even hold cash… i am thinking the index will be affected over time as more and more buying pressure from retirement indexing, and now this.
Hi Heather,
Please keep doing what you do. We are all grateful! I’ve been reading the books and following the books for over two years. I do not know of any other author that compares to your books or your blog… I always admire the way you back up your statements or thoughts with actual data. Imagine that!! Leveraging the charts with IN/OUT signals tied to human behavior is genius. Now, when I occasionally turn on CNBC, I just laugh at the commentary.
Keep up the excellent work and know that we appreciate the time you put into all of this!
Jeff
Hi Heather,
I just recently got your book as a recommendation and ordered it right away. I am in my 30s so I have enough time to build wealth so I thought I should give this strategy a try.
For now I opened one SPY 50% and one QQQ 60% DITM Call. As always I tend to start a new strategy at the worst time so both positions are down already. I will stick to the rule and not act on emotions.
Looking forward to learn and stay in touch with you and the community around the strategy.
Best regards from Germany
Philipp
Vix – yes. / crystal ball – yes too ( wouldn’t that be nice ). I find it amazing that the markets rely on news to make their dramatic jumps one way or another. And that successful launch of SpaceX rocket does absolutely nothing for the stock… R
Hey Randy – yes, would love a crystal ball – that worked!
And Space X – I haven’t really checked out its effect on the tech indexes – I’ll add it to the list of things needing investigation!
h
Amazing work Heather!! Been following books and blogs for couple of years and always learning from you. Thank you!!!
Hi VE (?)
Thank hyou for your kind words, glad you have found them useful.
h
Hi heather,
Want to thank you for your passionate giving of yourself and your knowledge to all your readers and followers, such as myself.
I would like you to do a blog on the vix and if you could do one in the future on the different types of candles, Doji, hammer, engulfing etc. and how volume works with them I would be very thankful.
Hope your healing and are like new again, Jim
Hi Jim – thank you! I sometimes wonder why I do it – especially when someone has asked ‘what’s your angle?’ – but getting comments like this makes it worthwhile.
Re candles – yes I will put that one the BLOG list as they are interesting – my position is that they help us understand what is happening in the market, but they are nnot reliable enough to trade from.
But yes, good idea – will do a blog on that.
h
Thanks again Heather, another insightful read. Yes, an explanation of the VIX would be great and I look forward to it.
Cheers,
Richard.
HI Richard – I’ll finish off the tech indexes next week then do the Vix the week after.
h