Last week we looked at the Nasdaq and discovered that QQQ isn’t the Nasdaq. This week, we are going one layer deeper – because “technology” isn’t one investment either.
Technology isn’t one sector. It is a supply chain.
Let’s follow a single request through the technology stack.
You type a question into an AI program. The answer appears almost instantly, but underneath, there is a lot going on. Like the duck gliding serenely across the water while paddling frantically below.
One click. Seven layers.
One click sets the entire stack in motion:
Chips calculated it.
Servers house the chips.
Data centres house the servers.
Networks move the data.
Cloud platforms run it.
Software delivered it.
Cybersecurity protected it.
That explains why buying “technology” can mean buying very different businesses.
We all know that billions have been committed to AI.
But where has the money actually gone?
This week, rather than examine all seven layers, we’re going to compare the two ends of the AI story: the companies that built the machinery and the companies expected to use it.
Where the money has gone
The Building Blocks: Semiconductors
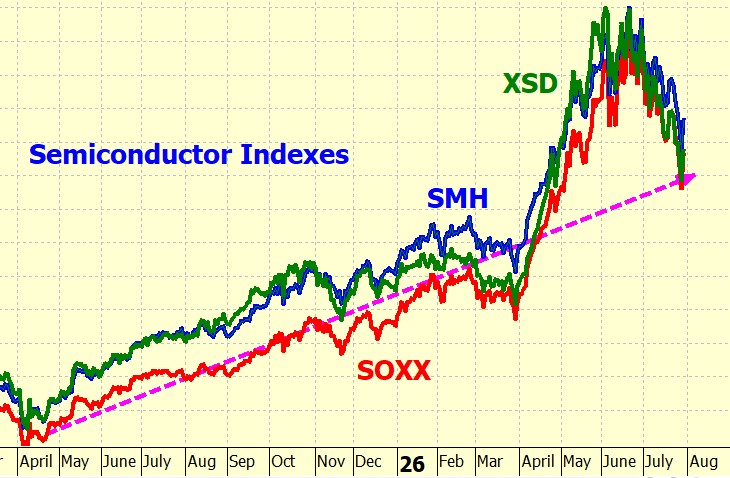
The first AI money went into building the machinery. Semiconductor indexes soared -until good results were no longer enough. They were expected. Expectations had risen even faster than earnings.
As we have seen recently, semiconductor companies could produce excellent results, beat analysts’ forecasts hands down—and still be punished. Once expectations become high enough, “excellent” can be disappointing.
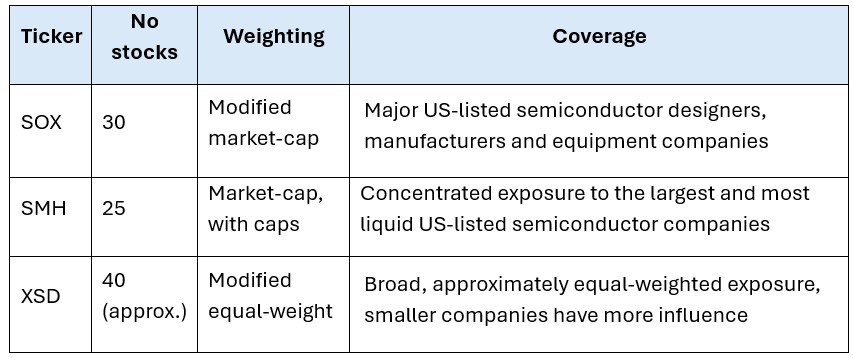
There are numerous semiconductor indexes and ETFs. Here are three of the best known:
They had been on a tremendous bull run – until they came back to earth at the pink dashed line.
A rebound? Possibly. The chart might support it.
In actuality? Who knows?
Where the market hasn’t followed
The users: SaaS
Software-as-a-Service companies were expected to be major AI beneficiaries. But many faced the opposite problem.
The cost of adding AI was immediate. The software companies still had to prove that customers would pay enough for it to justify what had been spent.
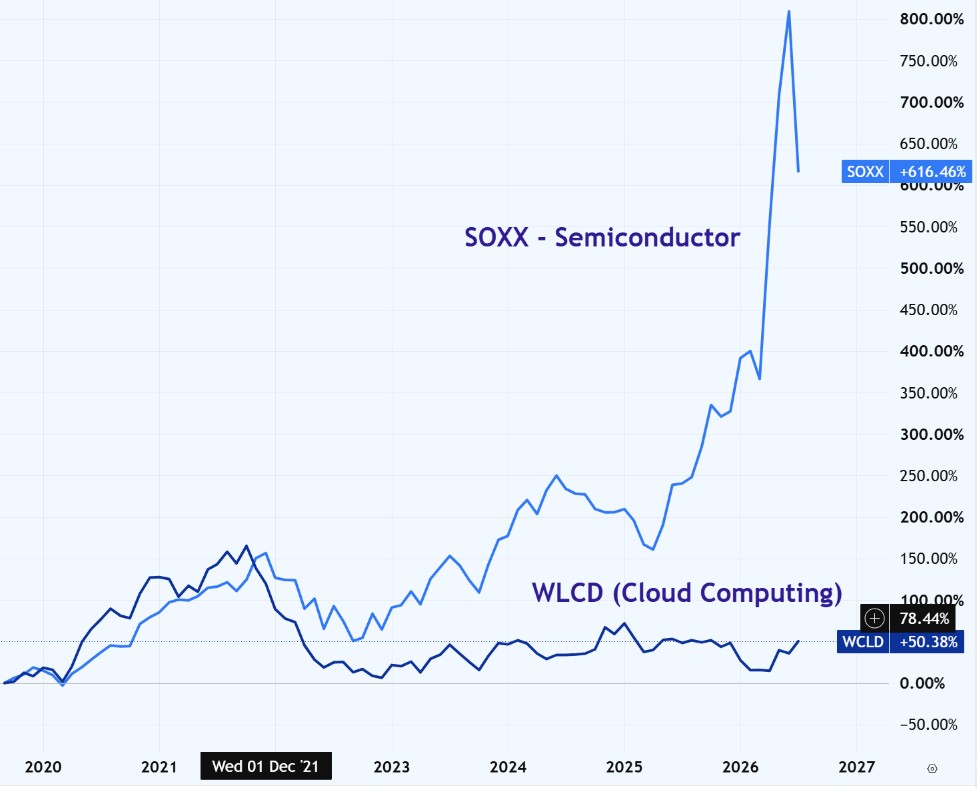
The closest investable measure I can find is WCLD, the WisdomTree Cloud Computing Fund. It tracks the BVP Nasdaq Emerging Cloud Index, which currently contains around 66 companies providing cloud-based software and services.
WCLD performed spectacularly during the COVID period, as did many other technology companies such as Zoom. Since then, however, it has been far from stellar.
Here WCLD is compared with SOXX, an ETF that tracks a broad index of semiconductor companies. Both are shown on a percentage scale.
Since ChatGPT was launched at the end of 2022, SaaS has essentially flatlined while semiconductors have taken off.
The builders were paid first. The users still had to prove that the investment would pay.
Why the Nasdaq-100 has been falling
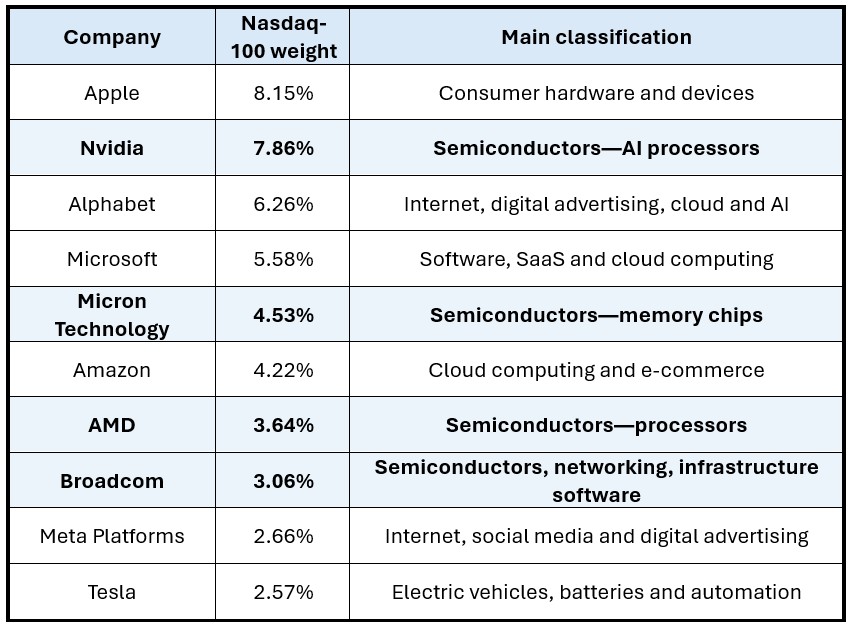
The Nasdaq-100 holds companies from across the stack—but not equally. Several of its largest semiconductor holdings currently exert far more influence than its numerous, much smaller software businesses.
Weights as at 30 June 2026.
Semiconductor Stocks
The four highlighted semiconductor companies – Nvidia, Micron, AMD and Broadcom – accounted for approximately 19% of the Nasdaq-100.
When investors began questioning the likely return on the enormous sums being spent on AI, these heavily weighted semiconductor shares fell – and pulled the entire Nasdaq-100 down with them.
SaaS Stocks
SaaS, meanwhile, has been quietly left behind.
WCLD is broadly spread across dozens of emerging cloud companies. At 30 July, its largest holding, Datadog, represented just 2.82% of the fund. Palo Alto Networks was next at 2.66%.
Even these companies have little influence on the Nasdaq-100. Palo Alto Networks, for example, represented only about 1.2% of the index.
Although Microsoft, Alphabet and Amazon operate enormous cloud businesses, WCLD targets emerging companies whose primary business is cloud software. It does not hold the established technology giants.
What happened during July
Semiconductor shares had enjoyed a tremendous run – and then reversed as investors questioned whether the massive expenditure on AI would produce adequate returns.
Because chip companies now carry so much weight, their falls pulled the Nasdaq-100 down with them.
Then came the sharp rebound.
Microsoft reported 43% growth in Azure. Amazon reported 37% growth in AWS – its fastest cloud growth in more than four years. Investors were suddenly reassured that all that AI expenditure might indeed be producing results.
The Nasdaq-100 was not simply “technology going down.”
It was the market repeatedly reassessing which layer of the AI stack would make the money – and when.
One label. Very different businesses.
The builders were paid first.
The users still have to prove that the investment will pay.
The lesson is to look beneath the “technology” label. Which part of the stack are you actually looking at?
To the markets . .
A mixed week – but look on the bright side: we ended the week higher than last week. Not a lot, I admit. But in this sideways – or consolidating – market I’ll take all the good news I can get. I must say I find consolidation periods extremely tedious – but then when we go into a downward slope I long for sideways!
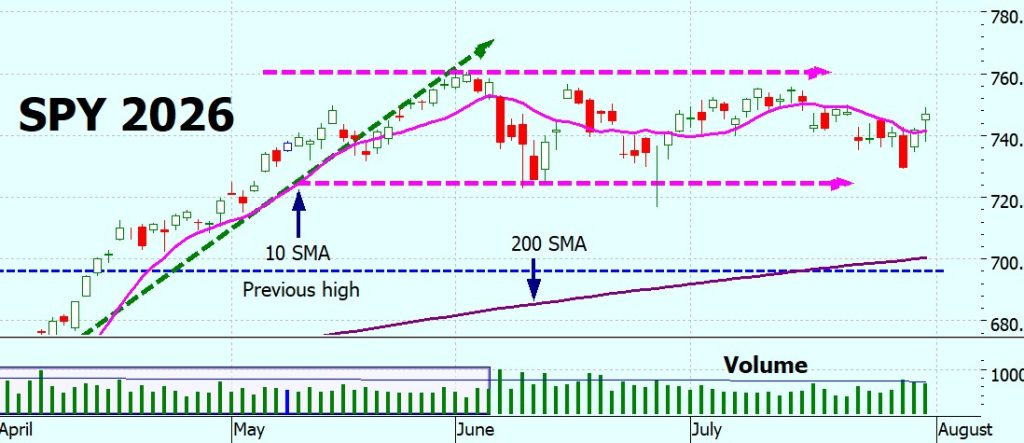
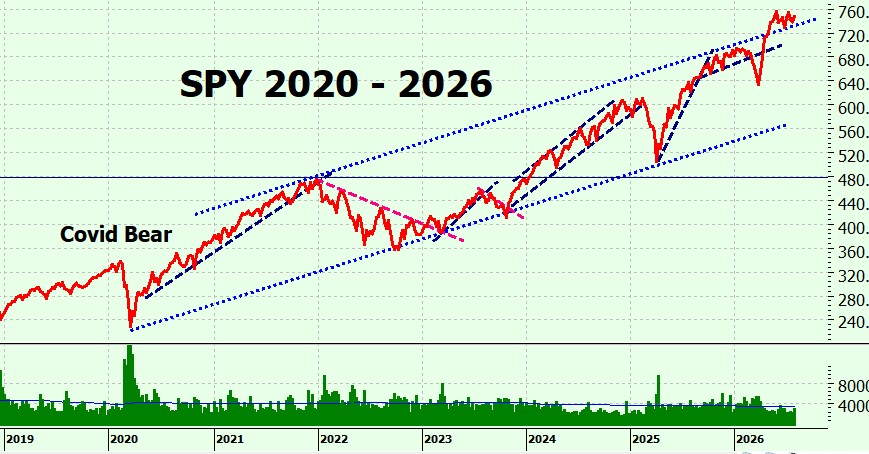
SPY Charts
Wednesday was a particularly nasty day – a big red candle heading towards the support line (pink dashes). It did not look good. However, Thursday and Friday were more positive and on reasonable volume.
Longer term, SPY seems to be using the upper boundary of the trading channel as a support line. I am not complaining in the slightest.
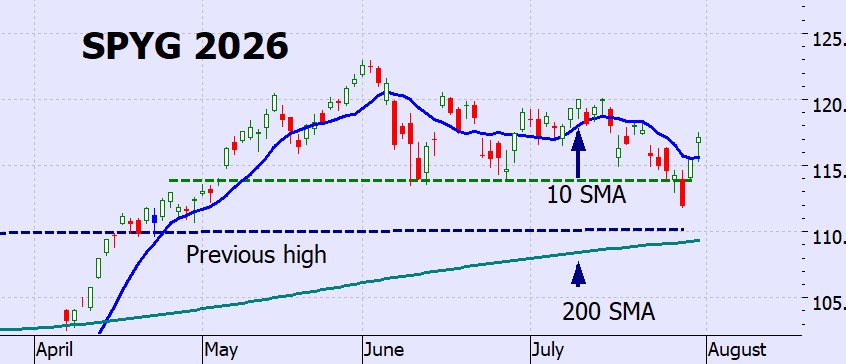
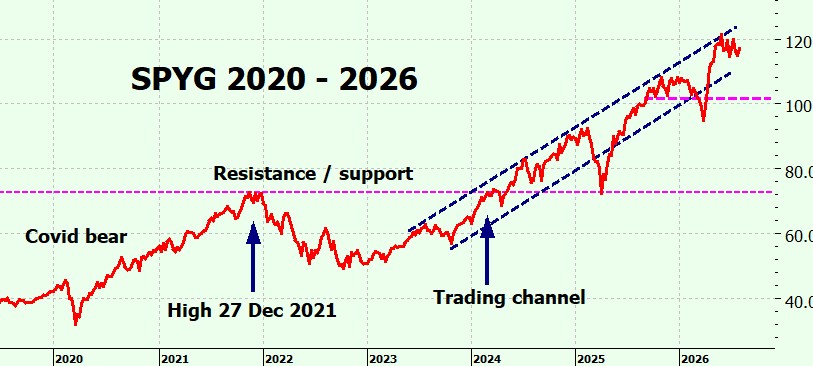
SPYG Charts
Last Wednesday did not look good on SPYG either: heading down towards the previous high. But Thursday and Friday saw upticks – and closed above the 10-day SMA for the first time in a while. Clutching at straws? Very possibly.
Longer term, SPYG is in the middle of its trading range, and you can clearly see the sideways movement.
QQQ Charts
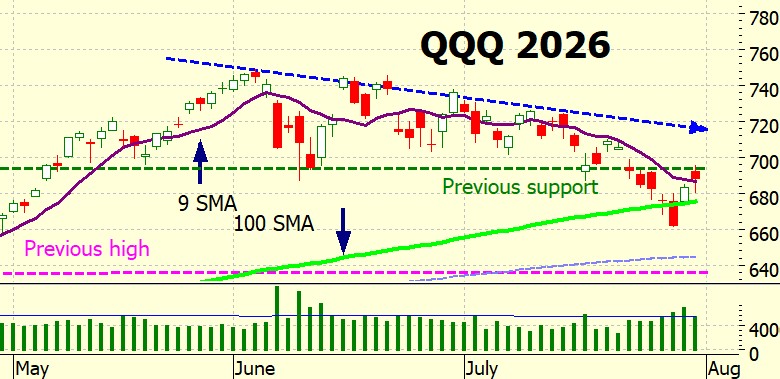
And the one that has been giving us all a headache! Last week we were thinking that we might be heading for a death cross – well, we have had a last minute reprieve!
Wednesday was awful, but Friday saw us back at the support level—although still on the wrong side of it. If QQQ breaks back through, it will be a good sign. If it falls again, the previous support may become resistance. Let’s hope not.
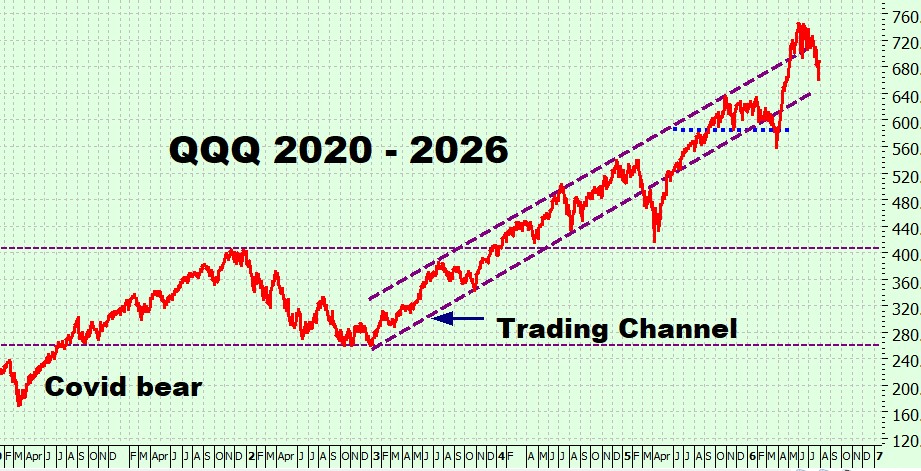
Longer term, we can see how serious the dip was – or is. If the trading channel is to hold, QQQ can’t drop much further. Let’s hope it does hold.
VIX Chart (Volatility)
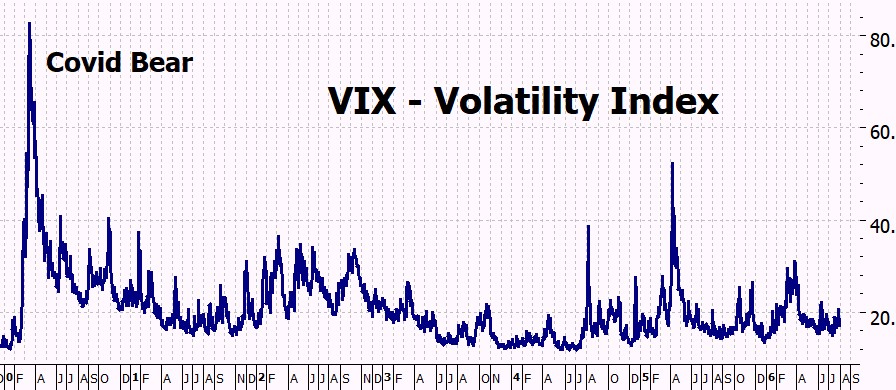
The VIX seems unperturbed.
ITMeter
The week ahead . . .
This week’s focus shifts to the US labour market, with employment reports building towards Friday’s crucial jobs figures. Manufacturing and services activity will also be closely watched, while results from Palantir, AMD, Eli Lilly, Uber and Disney could produce further volatility across technology and the broader market.
Monday
Reports: Manufacturing PMI, ISM Manufacturing, Construction Spending
Earnings: Palantir, ON Semiconductor, Marriott, Tyson Foods
Tuesday
Reports: US Trade Balance, JOLTS Job Openings, Factory Orders
Reports: Nonfarm Payrolls, Unemployment Rate, Average Hourly Earnings
Earnings: Allianz, Munich Re
The futures . . .
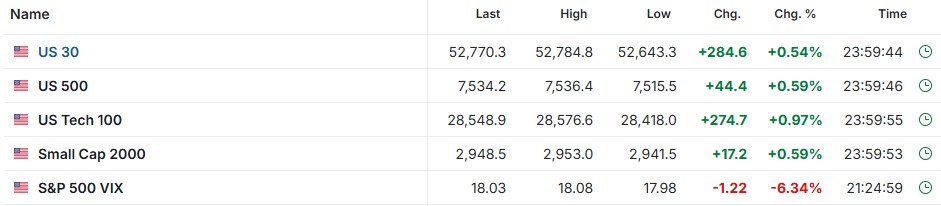
The headlines are bad:
But the futures don’t seem to have read them:
Heather
Trade the tide, not the waves
Q & A
Sorry everyone, I’ve got a bit behind with the comments. I will transfer anything that I didn’t answer last week to this week and answer them here.
15 Responses
I’d like to supplement my income monthly, does this strategy allow for that?
THANK YOU!
Jared
HI Jared – I think I have got mixed up when transfering the comments – I just answered that?
Here’s what I said: HI Jared – no, the ITM Plan is not made for regular income. The market doesn’t pay a salary. ITM if for longer term capital growth.
Some of the ‘income strategies’ deplete your capital while keeping you focussed on weekly income – I have done a blog on it here: https://heathercullen.com/blog/selling-your-upside/
Hope that helps.
h
I would like to see the VIX explained. I too am tired of not being able to look at my account. In SPY, QQQ, SPYG. Great job calming my nerves, concerned on QQQ. But going to ride the tide. Question do you immediately get out if a dead cross happens, or do you wait to see if it holds for a day or two.
Thanks
Robin
HI Robin – well, you should have ben able to look at your account this week!
Re the death cross – it isn’t a time thing (see previous answer) it is a gap between them thing – 1.5%.
The rule is that the 10 and 200 SMAs have to be 1.5% apart – they must hace actually crossed and you can see ‘white spce’ between them. Sometimes it happens in a day – other time it has taken a week or more, and sometimes – actually quite frequently – they touch but don’t actually cross.
The backtesting has shown that the 1.5% gap performs the best.
Hope this helps
h
If there is a good gap, I’m assuming I’m ok to get into the Bull strategy in the SPYG as of today, but as soon as it crosses I get out and wait for it to cross again — I believe the book said to get in the next day when the signal hits, so I may be answering my own question here with needing to view the signals on the daily.
Appreciate your insights and wisdom here Heather!
Jared
HI – when the ITMeter is pointing to the bull it is OK to get in – when we see a death cross it is time to get out.
The rule is that the 10 and 200 SMAs have to be 1.5% apart – they must hace actually crossed and you can see ‘white spce’ between them. Sometimes it happens in a day – other time it has taken a week or more, and sometimes – actually quite frequently – they touch but don’t actually cross.
The backtesting has shown that the 1.5% gap performs the best.
Hope this helps
h
Am I looking at the crosses on the DAILY or MONTHLY timeframe when looking for signals to get in and out?
Jared
HI there – always on a daily chart.
I have put the instructions on the charts on the website, have a look at this: https://heathercullen.com/stock-charts/
(remember to scroll to the bottom for the instructions)
Hope this helps
h
When do you take profits? If I’m wanting to supplement my income with this strategy, I wasn’t quite clear on what that looked like and if there was a process there and how this correlated with the rolling of the options.
Jared
HI Jared – no, the ITM Plan is not made for regular income. The market doesn’t pay a salary. ITM if for longer term capital growth.
Some of the ‘income strategies’ deplete your capital while keeping you focussed on weekly income – I have done a blog on it here: https://heathercullen.com/blog/selling-your-upside/
Hope that helps.
h
HI Jared – its a short answer – no, the ITM Plan does not involve taking profits as it is generally understood.
We get in at a confirmed golden cross and get out at a confirmed death cross – and most of the time we are banking profits. But that is because it is time to get out of the market, not because a particular level of profits has been reached.
You may want to have a look at this blog which highlights that we don’t know when it is a good time to “take profits” https://heathercullen.com/blog/riding-the-bull/
Hope that helps
h
Hi Heather,
I just resigned from a job and I am rolling that 401k into an IRA. I know the signal is on, but mentally it is hard to jump in at all time highs. Do you just not think about it and follow the rules? Also, when you are at all time highs, is it smarter to lean into SPY vs QQQ.? Not asking for financial advice, more reasoning through all of this.
Thanks,
Jason
Hi Jason – it is scary resigning and striking out on your own – I remember it well! But all the good luck in the world.
Re jumping in at highs – I’ve done a couple of blogs on it: https://heathercullen.com/blog/riding-the-bull/ https://heathercullen.com/blog/is-it-too-late/ https://heathercullen.com/blog/market-peaks/
The ITM backtesting has to go from golden cross to death cross – it is quite impossible to backtest for every possible entry point – but I have always found that whenever I waited for a ‘better time to get in’ I always missed the boat and kicked myself.
Remember – in a bull run ‘market highs’ are made every week or two – it isn’t anisolated occurrence. Re SPY and QQQ – ITM started on SPY and it has the longest history to test so I would recommend that – but QQQ is also pretty stable so perhaps go for a hybrid – say 60% SPY 40% QQQ?
Just an idea.
Hope this helps.
h
H- So my blood shot eyes see that the SPY is still in a range… and the other two ( this is where the crystal would help…). I have the chatGPT plus ( an extra 20.00 a month ) – I feel like I’m talking to a 10 year old Rocket Scientist. I have to remind myself it’s machine learning or I’ll pick it up and throw it across the room♂️. R
Ps I just want my personal Ai robot and my self driving car ( or personal flying drone ).
Hey Randy! sorry for late reply.
I love ChatGP – not for generating ideas (I do all that) but for checking and finding research etc. And recently (as I expect you have noticed) with generating images! Such fun to see your ideas come to life – just done next weeks blog and love the Eeyore images.
I don’t often feel like throwing it across the room – but I get frustrated with its directions – for example you ask a simple question like ‘i am in photoshop and I want to turn a vector int an object (or something like that) and you get 3 screens worth of instructions covering all possibilities if the previous instruction doesn’t work. I end up shouting at it’ONE STEP AT A TIME’.
H


































15 Responses
I’d like to supplement my income monthly, does this strategy allow for that?
THANK YOU!
Jared
HI Jared – I think I have got mixed up when transfering the comments – I just answered that?
Here’s what I said:
HI Jared – no, the ITM Plan is not made for regular income. The market doesn’t pay a salary. ITM if for longer term capital growth.
Some of the ‘income strategies’ deplete your capital while keeping you focussed on weekly income – I have done a blog on it here:
https://heathercullen.com/blog/selling-your-upside/
Hope that helps.
h
I would like to see the VIX explained. I too am tired of not being able to look at my account. In SPY, QQQ, SPYG. Great job calming my nerves, concerned on QQQ. But going to ride the tide. Question do you immediately get out if a dead cross happens, or do you wait to see if it holds for a day or two.
Thanks
Robin
HI Robin – well, you should have ben able to look at your account this week!
Re the death cross – it isn’t a time thing (see previous answer) it is a gap between them thing – 1.5%.
The rule is that the 10 and 200 SMAs have to be 1.5% apart – they must hace actually crossed and you can see ‘white spce’ between them. Sometimes it happens in a day – other time it has taken a week or more, and sometimes – actually quite frequently – they touch but don’t actually cross.
The backtesting has shown that the 1.5% gap performs the best.
Hope this helps
h
If there is a good gap, I’m assuming I’m ok to get into the Bull strategy in the SPYG as of today, but as soon as it crosses I get out and wait for it to cross again — I believe the book said to get in the next day when the signal hits, so I may be answering my own question here with needing to view the signals on the daily.
Appreciate your insights and wisdom here Heather!
Jared
HI – when the ITMeter is pointing to the bull it is OK to get in – when we see a death cross it is time to get out.
The rule is that the 10 and 200 SMAs have to be 1.5% apart – they must hace actually crossed and you can see ‘white spce’ between them. Sometimes it happens in a day – other time it has taken a week or more, and sometimes – actually quite frequently – they touch but don’t actually cross.
The backtesting has shown that the 1.5% gap performs the best.
Hope this helps
h
Am I looking at the crosses on the DAILY or MONTHLY timeframe when looking for signals to get in and out?
Jared
HI there – always on a daily chart.
I have put the instructions on the charts on the website, have a look at this:
https://heathercullen.com/stock-charts/
(remember to scroll to the bottom for the instructions)
Hope this helps
h
When do you take profits? If I’m wanting to supplement my income with this strategy, I wasn’t quite clear on what that looked like and if there was a process there and how this correlated with the rolling of the options.
Jared
HI Jared – no, the ITM Plan is not made for regular income. The market doesn’t pay a salary. ITM if for longer term capital growth.
Some of the ‘income strategies’ deplete your capital while keeping you focussed on weekly income – I have done a blog on it here:
https://heathercullen.com/blog/selling-your-upside/
Hope that helps.
h
HI Jared – its a short answer – no, the ITM Plan does not involve taking profits as it is generally understood.
We get in at a confirmed golden cross and get out at a confirmed death cross – and most of the time we are banking profits. But that is because it is time to get out of the market, not because a particular level of profits has been reached.
You may want to have a look at this blog which highlights that we don’t know when it is a good time to “take profits”
https://heathercullen.com/blog/riding-the-bull/
Hope that helps
h
Hi Heather,
I just resigned from a job and I am rolling that 401k into an IRA. I know the signal is on, but mentally it is hard to jump in at all time highs. Do you just not think about it and follow the rules? Also, when you are at all time highs, is it smarter to lean into SPY vs QQQ.? Not asking for financial advice, more reasoning through all of this.
Thanks,
Jason
Hi Jason – it is scary resigning and striking out on your own – I remember it well! But all the good luck in the world.
Re jumping in at highs – I’ve done a couple of blogs on it:
https://heathercullen.com/blog/riding-the-bull/
https://heathercullen.com/blog/is-it-too-late/
https://heathercullen.com/blog/market-peaks/
The ITM backtesting has to go from golden cross to death cross – it is quite impossible to backtest for every possible entry point – but I have always found that whenever I waited for a ‘better time to get in’ I always missed the boat and kicked myself.
Remember – in a bull run ‘market highs’ are made every week or two – it isn’t anisolated occurrence. Re SPY and QQQ – ITM started on SPY and it has the longest history to test so I would recommend that – but QQQ is also pretty stable so perhaps go for a hybrid – say 60% SPY 40% QQQ?
Just an idea.
Hope this helps.
h
H- So my blood shot eyes see that the SPY is still in a range… and the other two ( this is where the crystal would help…). I have the chatGPT plus ( an extra 20.00 a month ) – I feel like I’m talking to a 10 year old Rocket Scientist. I have to remind myself it’s machine learning or I’ll pick it up and throw it across the room♂️. R
Ps I just want my personal Ai robot and my self driving car ( or personal flying drone ).
Hey Randy! sorry for late reply.
I love ChatGP – not for generating ideas (I do all that) but for checking and finding research etc. And recently (as I expect you have noticed) with generating images! Such fun to see your ideas come to life – just done next weeks blog and love the Eeyore images.
I don’t often feel like throwing it across the room – but I get frustrated with its directions – for example you ask a simple question like ‘i am in photoshop and I want to turn a vector int an object (or something like that) and you get 3 screens worth of instructions covering all possibilities if the previous instruction doesn’t work. I end up shouting at it’ONE STEP AT A TIME’.
H