Market Pessimists

Picture of Heather Cullen

Heather Cullen

ITM BLOG

Heather Cullen ITM Blog - Market Pessimists - The Eeyore Effect.

| The Eeyore Effect |

We’ve had some heart-stopping days recently when market drops tested our confidence in the ITM strategy. Because I’m in Australia everything happens overnight – so the first thing every morning I reach for my iPad to see where things landed.

And some days it has not been a good way to start the day!

Your Inner Eeyore

Recent research shows that investors consistently assess the likelihood of a catastrophic market crash as far higher than its historical frequency would justify.

In other words – we are all Eeyores. Gloomy, pessimistic, and quietly resigned to impending misfortune. We convince ourselves that the next major crash is always right around the corner.

“It’s snowing still,” said Eeyore gloomily.
“So it is.”
“And freezing.”
“Is it?”
“Yes,” said Eeyore.
 

“However,” he said, brightening up a little, “we haven’t had an earthquake lately.”

But . . . the weather?

Interestingly, our emotional state influences this risk assessment in surprising ways.

Researchers found that even unusually bad local weather can measurably darken an investor’s mood, causing them to increase their estimated probability of a market crash.

In other words, investors were not simply evaluating risk objectively. Their emotional state was influencing what they believed the risk to be.

Memory Highlights: the 9/11 Effect

Our memories don’t help. They do not treat history neutrally or evenly.

If someone asked you what you were doing a year ago last Tuesday you almost certainly would not remember. But if someone asked you what you were doing on 9/11 you could likely answer in seconds.

Why? Because our memories prioritize the extreme highlights – the events out of the ordinary – while normal, everyday occurrences quietly blend into the background.

Market Memories

A recent study of over 17,000 retail investors found that we process market history in the exact same way. We vividly recall the terrifying crashes and spectacular rallies, while the long, steady stretches where nothing dramatic happened disappear from our minds entirely.

If you were asked about the covid crash you would probably remember the month, the panic and how fast the market fell. But if you were asked about the lovely bull run afterwards – how long it lasted or the percentage it gained – your memory is probably much hazier.

Heather Cullen ITM Blog - Market Pessimists - The Eeyore Effect.

“Good morning, Pooh Bear,” said Eeyore gloomily.

“If it is a good morning,” he said.

“Which I doubt,” said he.

Selective Memory

Our memories are also heavily influenced by what the market is doing right now.

  • In a Down Market: Memories of previous market crashes become much easier to recall, making a larger disaster feel inevitable.
  • In an Up Market: Memories of spectacular gains come straight to the front of our minds, making further gains feel guaranteed.

We then use those selective memories to form our expectations of what will happen next.

It is rather like judging your entire life from a highlights reel containing only your greatest triumphs and worst disasters. All the perfectly ordinary days – the ones that make up most of a lifetime – have been edited out.

Fear & Greed

Selective memory leaves us vulnerable to both fear and greed. The market mechanics may not have changed, but the evidence our memory chooses to present to us has shifted completely.

Understanding this mental bias is precisely why we rely on objective rules rather than our visceral reaction to a chart:

  1. Expect the Asymmetry: Recognize that feeling pessimistic during a drawdown is a biological memory response, not a directional forecast.
  2. Trust the Long-Term Sample Size: Market history is defined by long, quiet stretches of compounding, punctuated by brief moments of volatility.
  3. Stick to the ITM Plan: The strategy exists specifically to remove emotional perception and memory bias from risk management.

Don't let Eeyore make the decisions

When you check the charts or read the headlines and feel that instinctive urge to worry, remember: your brain is playing the highlight reel.

Stick to the strategy, respect the probabilities, and let the ITM Plan do its work.

We don’t have to stop being Eeyores.

We just need a plan that stops Eeyore making the decisions.

Heather Cullen ITM Blog - Market Pessimists - The Eeyore Effect.

“That Accounts for a Good Deal,” said Eeyore gloomily.

“It Explains Everything. No Wonder.”

To the markets . .

A much better week. About time too!

SPY Charts

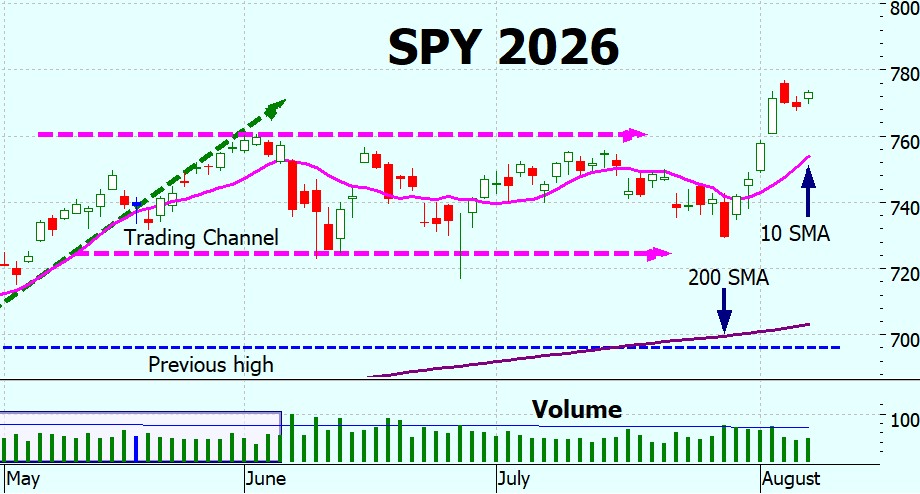
Last week we were hopeful that SPY would break out of its channel – and it has! And in the right direction – up.

A very nice week, really. The two up days (the large green candles) were on higher-than-average volume (100-day SMA) and the three subsequent days with small-bodied candles on lower volume – signaling that investors were more enthusiastic on the up days. It is quite normal for prices to ‘take a breather’ after a few strong up days.

Heather Cullen ITM Blog - Market Pessimists - The Eeyore Effect.

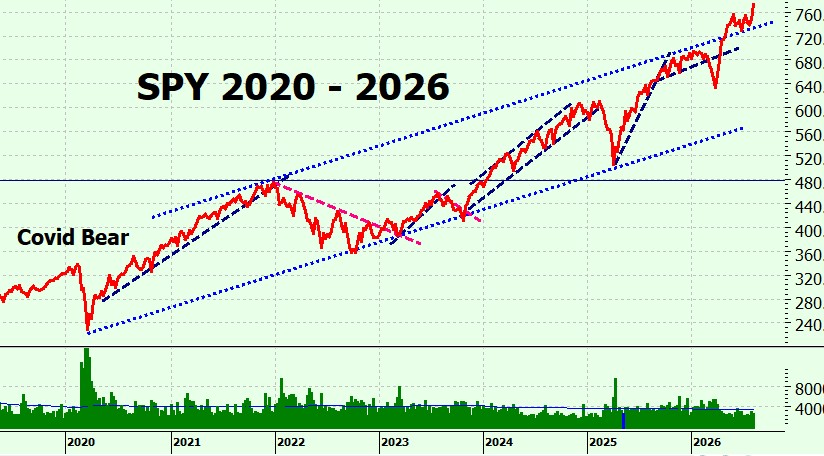
On the long-term chart it seems as though SPY has decided to treat the upper bound of the trading channel as the new support trend line. Well, I’m fine with that!

(Thought: maybe I should put the long term chart on a log scale. What does anyone think? Would that be more helpful?)

SPYG Charts

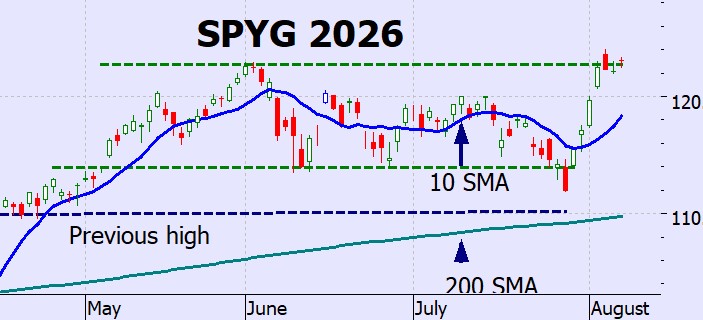
SPYG has also had a very nice week – but hasn’t quite broken out of its trading channel. It has been flirting with it for a few days now. Let’s hope it decides to go north!

Heather Cullen ITM Blog - Market Pessimists - The Eeyore Effect.

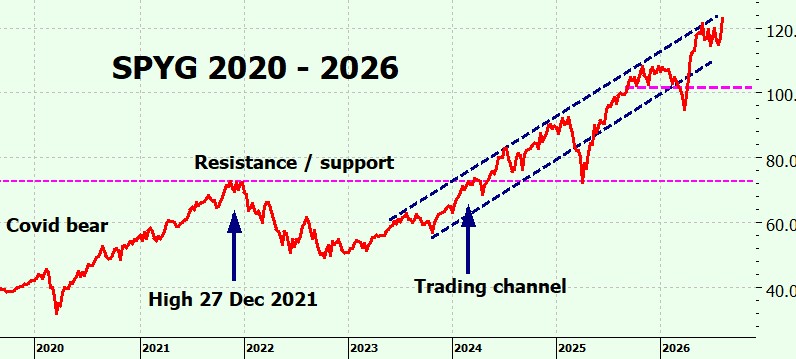
On the long-term chart SPYG is headed toward the top end of the trading channel. It would be nice if, like SPY, it decided to break out and treat it as the new trend line.

QQQ Charts

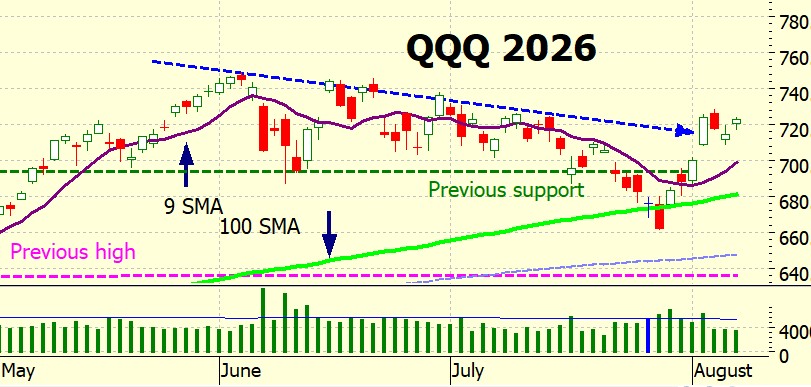
QQQ has also had a nice week – but hasn’t made new highs yet, although it seems to have pierced the blue dashed downtrend line. Which is a good sign – but remember, these are only lines on a chart, drawn by a person (me) not a proclamation from on high.

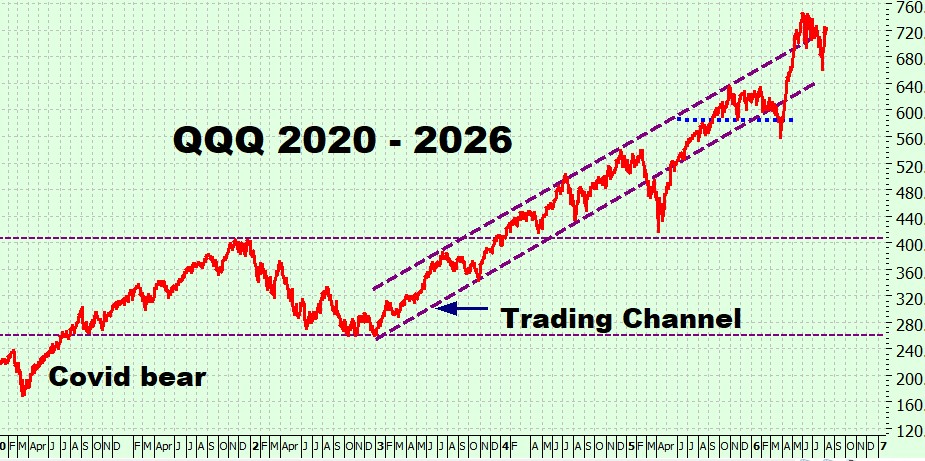
Long term, QQQ is back at the upper bound.

VIX Chart (Volatility)

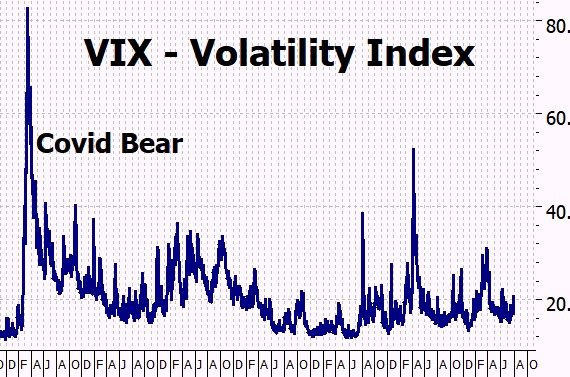
The VIX is sitting around 20, nothing remarkable.

ITMeter

Heather Cullen In The Money ITM BLOG Options Nuts Bolts

The week ahead . .

The big market-moving days are likely to be Wednesday’s CPI, Thursday’s PPI and Friday’s retail sales.

Monday 10 August

  Announcements: No major announcements.

  Earnings: Barrick Mining, Monday.com, Rocket Lab, Hims & Hers.

Tuesday 11 August

  Announcements: NFIB Small Business Optimism, Existing Home Sales.

  Earnings: CoreWeave, Super Micro Computer, Sea, Tencent Music, CAVA.

Wednesday 12 August

  Announcements: CPI, Core CPI, Treasury Budget.

  Earnings: Cisco Systems, Coherent, Nebius, Brinker.

Thursday 13 August

  Announcements: PPI, Core PPI, Weekly Jobless Claims.

  Earnings: Applied Materials, JD.com, Tapestry, Birkenstock.

Friday 14 August

  Announcements: Retail Sales, Business Inventories, University of Michigan Consumer Sentiment and Inflation Expectations.

  Earnings: No major earnings.

AMD will remain in focus after strong results failed to satisfy elevated AI expectations. Cisco should provide another indication of demand for AI networking infrastructure.


CoreWeave, Super Micro Computer, Lumentum, Coherent and Applied Materials will also offer useful evidence about spending across AI cloud computing, servers, optical networking and semiconductor equipment.

The futures . .

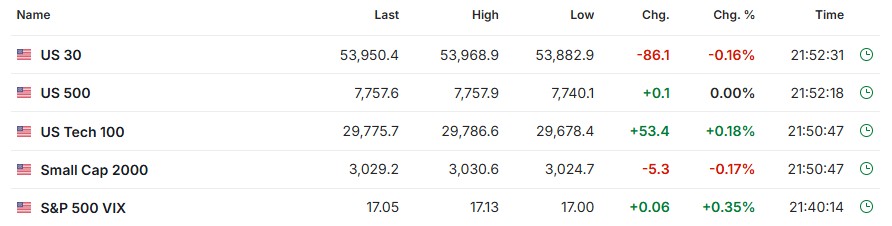
Are pretty neutral – still 12 hours to market open.

Logging back in . . .

It was a nice change to log in to one’s accounts again – I mentioned a couple of weeks ago that when the market was dropping I kept a close eye on what was happening but I deliberately didn’t look at my accounts.

And funnily enough – there’s some research on that! I‘ll go through that in next week’s blog.

Have a great week!

Heather

Trade the tide – not the waves.

Q & A

I think I am up to date with the questions – but if I have missedyou out please post it again here.

14 Responses

  1. Interesting developments here in Silicon Valley. Older chips rather than being worth less are being sold or re-leased at higher prices than the originals. I have heard it from several sources this week. Even A100s are worth more than their original prices. This means demand continues to outstrip supply.

    1. HI Kate – I didn’t know anything about this – it is a very interesting development.
      Would you be inverested in writing a short piece for the blog next week? Just explaining?
      Thanks
      heather

  2. I’m just curious, what is your opinion on investing in DITM calls of RSP instead of the SPY?

    1. HI Roger – just had a look at the chain – and suggest it is not a good idea. currently trading at $222.96 means that if you look for a 50% strike expiry Jan 27 the bid / ask is $111.00 / 116.10
      Than is 5% – which means you have lost 5% just getting into the trade.
      The reason is clear if you look at the OI (open interest) – most strikes have no OI which means that there are no traders buying and selling – hence the bid / ask is set by market makers not the market.
      Here’s a blog I did on it a while ago – the numbers will be outdated but the principle is the same: https://heathercullen.com/blog/liquidity-and-open-interest/
      Hope this helps.
      h

    1. Thank you , Robin!
      Yes, it is easy to get swept up in the waves and carried away – I’ve been there many times in the past, and always regretted it.
      It is actually quite settling for me to research and write about it – I always think that to explain anything you have to really understand it yourself – so it helps me too!
      h

  3. Hi Heather,

    Thank you for your blog. I look forward to reading it every Monday. You always have such great advice on how to perceive what is going on with the markets. As for the log scale on the long-term charts, I think that is a terrific idea. I think they just make everything look clearer.

    Thanks again for all you do for us!

    1. Hi Charity – thank you!
      RE the charts – Robert below had a good idea – shwo both at least for some weeks. Ill probably to that, seems logical!
      h

      1. Greetings, Heather!
        Yeah, BOTH logarithmic and linear sounds good. I for one would still like to see the linear. And thanks for this very helpful and very readable blog.

  4. Showing long term charts with a log scale would be interesting to see. If you did I would like to see them in both formats for a few weeks to adjust how my brain processes them. I know it shows that the past was better than it looks on a “standard “ scale – but it seems that the more time that has passed the less relevant it is now. (Or was that part of the point of this week’s essay).

  5. I opened my account for the first time in weeks last week ! Hurray ! Can’t wait to read this research in next weeks blog !

Heather Cullen

ITM Blog

Heather Cullen

Thank you – your message has been sent.

You will be notified when there is a new blog post.


Please note that Heather answers all questions at the end of the ITM Blog.


Happy trading!