Monday 31 August
Announcements: No major announcements.
Earnings: Science Applications International.
Tuesday 1 September
Announcements: Final Manufacturing PMI, ISM Manufacturing Index, JOLTS job openings, construction spending.
Earnings: Nio, Dell Technologies, Palo Alto Networks, MongoDB, GitLab, Credo Technology.
Wednesday 2 September
Announcements: ADP Employment Report, factory orders, Federal Reserve Beige Book.
Earnings: Broadcom, Snowflake, Hewlett Packard Enterprise, NetApp, C3.ai.
Thursday 3 September
Announcements: Weekly jobless claims, revised productivity and labour costs, trade balance, final Services PMI, ISM Services Index.
Earnings: Ciena, Lululemon, DocuSign, Zscaler, UiPath, Samsara, Asana.
Friday 4 September
Announcements: Nonfarm payrolls, unemployment rate, average hourly earnings.
Earnings: RH, Korn Ferry.




































6 Responses
Hello Heather,
Always good to read your blog. You never disappoint with any of your content.
I’ve been playing around with Claude recently just to evaluate its capabilities and thought I’d get its take on Dennis’s proposal re futures contracts, so I pasted in his proposal, and then pasted in your reply and the following is what I got back. It also included charts and tables that I can’t include here. Claude is pretty impressive, more so than ChatGPT I’d say.
Great connection to pull on — and this is very buildable with what we already have. Dennis’s core claim (“no time value, cleaner implementation”) and Heather’s concern (margin/mark-to-market risk) are both testable directly from our existing signal and data.
Modeling approach: I don’t have historical ES/MES futures data, but a fairly-priced, continuously-rolled S&P futures position is economically close to holding the index itself while posting only margin (not the full notional) — the “cost of carry” pricing largely cancels out, so the return profile should track the underlying’s total return closely, without the option’s extrinsic-value decay. That means the cleanest way to test this is to compare the 10/200 signal applied to shares (a fair proxy for fairly-priced futures P&L) against what we already built for deep-ITM calls — the difference between those two is roughly the cost Dennis is pointing at.
Then, separately, I’ll directly test Heather’s margin worry: what’s the worst peak-to-trough decline the position would have had to absorb while still in a trade, before the exit signal fired?
Ran 2 commands, created a file
I need to correct something before presenting this — my equity curve above only marked P&L at trade boundaries, not daily. Since Heather’s whole concern is about daily mark-to-market, that’s exactly the wrong way to measure this. Let me rebuild it properly.
Ran a command
Good — corrected: the true daily-marked drawdown is −20.3% (not the −8.3% my trade-boundary-only calculation showed), occurring in June 2020, which lines up closely with the −18.9% intra-trade figure I found looking within individual trades. That’s the honest number, and it directly answers Heather’s question.
Now let’s actually engage with what Dennis and Heather are debating.
1. Dennis’s core claim — “no time value, cleaner implementation” — checks out mechanically. A fairly-priced, continuously-rolled futures position tracks the underlying almost 1:1 with no optionality decay. Modeling it this way (using the 10/200 signal on shares as the proxy, since fairly-priced futures P&L should track total return closely):
This is the real finding: at matched 1x notional exposure, futures give you lower return and lower drawdown than the deep-ITM calls — because the DITM calls carry embedded leverage (you’re controlling a full share’s worth of exposure for only 50-60% of its price), which is where their extra return and extra risk both come from. Dennis’s letter undersells this a bit — futures aren’t just “cheaper,” they let you dial in exactly how much leverage you want (via MES’s $5 multiplier) without paying for it in decaying extrinsic value. If you sized futures contracts to match the DITM calls’ ~1.7-2x effective notional exposure, you’d likely get similar or better returns than the DITM version, without ever bleeding time value — that’s the genuine structural edge futures have, and it’s a more precise version of what Dennis is gesturing at.
2. Heather’s margin concern — this is answerable with real numbers, and it’s a fair worry. I checked the worst peak-to-trough decline the position would have had to sit through while still in a trade, before the trend-exit signal fired:
Worst case: −18.9% to −20.3%, right into the March 2020 COVID crash (the Feb 2019 → Mar 2020 trade). The 10/200 signal is inherently laggy — it didn’t get the account out before that decline happened, only after.
Second worst: −17.3%, during the 2011 debt-ceiling/European crisis scare.
The strategy did successfully sidestep almost all of the 2008 GFC (it was flat/out of the market for ~18 months spanning the worst of that crash) — but that’s a matter of timing, not guaranteed protection.
What this means for margin practically: if you were running this near 1x notional via futures, a margin/cash buffer sized to comfortably absorb a ~20-25% adverse move (with some room beyond the historical worst case, since 2020 isn’t guaranteed to be the worst future case) would likely have kept you clear of a margin call historically. If you leverage up further (say 2x notional, closer to matching the DITM calls’ embedded leverage), that same 18.9% underlying move becomes roughly a 38% hit to your margin account — which is where Heather’s instinct to be cautious is well-founded. Her stated preference for defined-risk-at-entry (DITM calls) over open-ended daily mark-to-market is a legitimate risk-management choice, not just “allergy” — it trades some of the futures approach’s cost efficiency for the certainty of a known maximum loss.
One honest caveat: this is proxied through SPY shares as a stand-in for fairly-priced futures, not actual ES/MES historical data — real futures would have small basis effects around quarterly rolls, and margin requirements themselves fluctuate (often increasing right when volatility spikes, which is exactly when you’d least want that). Heather’s instinct that this “would require a separate backtest incorporating contract sizing, cash reserves, and quarterly rolls” is the right call for anyone actually implementing this live — I’d treat what we’ve built here as a solid first-pass answer to “is this worth pursuing further,” not a final green light.
Want to push on the leverage-matching angle — size a futures-proxy position to roughly match the DITM calls’ effective exposure and see if it actually beats the options version once you strip out the time-decay cost?
Yes (me).
Applying those ratios (1.96x for the 50%-strike-equivalent exposure, 2.39x for the 60%-strike-equivalent) directly to the futures-proxy daily returns:
Ran a command
This settles it — at matched leverage, futures beat the DITM options on both fronts, confirming Dennis’s argument precisely.
At matched effective exposure, futures win on both metrics, every time. The gap (roughly +0.9 to +1.9 points of CAGR, and slightly shallower drawdowns) is exactly the cost Dennis was pointing at in his letter: even a deep in-the-money call still carries a sliver of extrinsic value that decays over the life of the option, plus our modeled volatility-risk-premium assumption (IV priced a bit above realized vol, which is realistic for how options actually trade). Futures don’t carry either of those costs — the P&L is purely linear against the underlying’s price move, so once you size the position to match the same effective leverage, you keep 100% of the return the leverage is generating instead of handing a small piece of it to time decay and implied-vol richness.
This is a clean, honest confirmation of Dennis’s core argument — futures aren’t just operationally “cleaner” (better liquidity, tighter spreads, flexible sizing via MES), they’re economically cleaner too: no optionality tax on the leverage you’re using. Heather’s counter — her preference for defined risk-at-entry over daily mark-to-market/margin exposure — is still the legitimate trade-off on the other side of this. The historical worst-case intra-trade decline we found earlier (−18.9% to −20.3% unlevered, so roughly −37% to −44% at this matched leverage) tells you concretely what a margin account would need to be sized to absorb. Futures buy you the better return/drawdown profile only if you’re comfortable managing that daily mark-to-market and margin risk directly — the DITM calls trade a small performance drag for the comfort of “I already know my maximum possible loss the moment I open the position.”
One thing worth flagging honestly: this is all still proxied through SPY’s own price history at a chosen leverage multiple, not real ES/MES contract data — actual futures would have small basis wobbles around quarterly rolls, and real margin requirements move around (often tightening exactly when volatility spikes, which could force you to de-lever at the worst possible moment even without a formal margin call). Heather’s instinct that this deserves its own dedicated backtest with real contract specs before going live is the right one.
Want to look at anything else here — e.g., stress-test what happens to the leveraged futures version if a future decline is meaningfully worse than the 2020 COVID case (a next-worst-case sensitivity test), or wrap up?
To be continued (me). Look forward to your feedback (me, not Claude).
Wow Eric – thats a lot to take in! I’d love to give feedback right away – but I am nose to the grindstone updateing the book and getting the Replication pack ready.
In a couple of weeks I should be able to life my head and looks at your work – it seems genuinely exciting – but I am being very strict with myself ATM – head down, no deviation.
But please keep me posted.
h
Hello Heather,
I’ve just been looking at CFDs on the US 500 (Trade Nation) and SPX ATM vertical put credit spreads as other alternatives using your rules.
The financing charges tend to kill off the CFD strategy.
Here is a summary from the work that I had Claude do:-
## Bottom Line
**DITM long calls were the best-performing, best-risk-adjusted way to express the leveraged directional bet.** Same 2x exposure as the CFD, same signal, but a fixed one-time cost (time value) beat a recurring daily financing charge every time — $168k vs $121k final value, on a 20-year backtest, with a shallower drawdown too (-21.5% vs -25.4%). If you’re going to trade this system with leverage, options structurally beat CFDs here, not because of market timing, but because of how the cost of leverage is charged.
**The CFD works, but pays a real, ongoing tax for its flexibility.** No expiry to manage, no strikes to pick — but that convenience costs you the financing spread every single day you’re in, compounding into a meaningfully worse outcome over decades. Worth it only if you specifically value not having to roll a position.
**The ATM put credit spread is the outlier, and not in a way to trust blindly.** It produced the largest number on paper, but its -60.6% drawdown happened during ordinary 2015-2016 chop, not a crash — proof that a slow 200-day trend filter doesn’t protect a strategy whose losses are realized fast and are already baked in by the time the signal reacts. This mismatch showed up exactly as predicted before we ever ran real numbers. Selling ATM premium wants a faster, tighter signal (closer to your existing 20-day XSP system) — pairing it with a 10/200 crossover is structurally the wrong tool for the job, however good the backtest number looks.
**The signal itself earned its keep.** Both directional strategies roughly halved SPY buy-and-hold’s max drawdown by sidestepping most of 2008 — that’s real, demonstrated value. But it isn’t foolproof: the 2019–2020 trade rode the whole pre-COVID rally up and gave it all back before OUT confirmed, a near-total round trip. A 200-day-anchored filter will always be a step behind on genuinely fast crashes.
**Caveats that still stand:** option pricing throughout is modeled (Black-Scholes off realized vol, not real historical quotes), financing was held at a constant rate across 20 years of very different rate regimes, and none of this includes transaction costs or slippage. Treat the shape of these results — leverage cost, drawdown reduction, the spread’s mismatch — as the reliable takeaway; treat the exact dollar figures as illustrative.
Hey Eric – this Claude chap is smart, isn’t he?
Seriously – this is really interesting – I have been burned in the past by CFDs – but I do have a TradeNation account – strangely, they phoned last eek and said they had noticed I hadn’t traded for a while and could they help? very polite!
I used it to follow Tom Hougaard on his live day trading a coupld of years ago – and I didn’t get anywhere near his results – even following his real time trades – so I shelved it. Maybe when I am over the current hiump I will go back and have another look.
But thank uyou- very interesting!
h
Hi Heather,
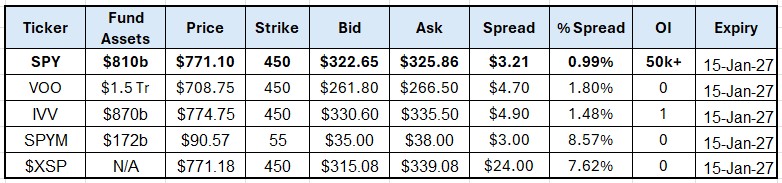
I enjoyed your latest piece on SPY versus SPYM. Have you ever considered using S&P 500 futures for the ITM concept instead?
We’ve been using futures for this concept for years. ES has a $50 multiplier and MES a $5 multiplier, so sizing can be very flexible. Compared with deep ITM options, they’re generally cheaper and simpler to trade, with excellent liquidity, very tight spreads and no time value.
The obvious drawback is margin, but with the strategy’s exit rules, you should normally be out well before margin becomes an issue in a major drawdown.
For systematic leveraged S&P 500 exposure, futures have always struck us as the cleaner implementation.
Curious whether you’ve looked at this before.
Best,
Dennis
Hi Dennis
Thank you—that is an interesting suggestion. No, I haven’t investigated using ES or MES for the ITM Plan.
I can see the attraction: excellent liquidity, tight spreads, flexible sizing with MES and no option time value. In principle, the same ITM signals could determine when to enter and exit the futures position.
My immediate reservation is that I am allergic to margin! One reason I have always preferred fully paid DITM calls is that the maximum loss is known at entry and there can be no margin call. With futures, the daily mark-to-market and the possibility of margin requirements increasing during a sharp decline would need careful modelling. I wouldn’t want to assume that the ITM exit signal would always arrive before margin became an issue.
It would therefore require a separate backtest incorporating contract sizing, cash reserves, daily gains and losses, margin requirements and quarterly rolls. But it is certainly a legitimate alternative—and one I had not previously considered.
Thank you for raising it.
H