Discipline? Or Denial?

Picture of Heather Cullen

Heather Cullen

ITM BLOG

Heather Cullen ITM Blog - Discipline or Denial

| Numbers I don’t need to see |

Not looking at my account is one of my strategies for dealing with down days. Not because I am ignoring the market or too afraid to look at it; it’s because I don’t want to translate a, say, 1% drop into actual dollar figures.

Why I don’t look at my account

I know that if I do, my brain will immediately convert the loss into everything I could have bought with it: Two months in a beautiful hotel in France …!  

That is not useful information. I don’t need it.

What I look at instead

Instead of monitoring account balances, I focus on market mechanics:

  • Price Charts: I read the candlesticks, check volume, monitor key SMAs, and track structural patterns (trends, channels, support, resistance, Darvas boxes).
  • Intraday Action: Reviewing intraday charts often provides context. A steady upward trend followed by a sudden late-day drop often signals sudden headline news rather than systemic weakness.
  • Factual News: I scan headlines strictly for objective data – earnings reports, CPI prints, or macroeconomic updates – to understand the underlying market sentiment.

The idea is to understand what has been going on in investors’ minds.

Heather Cullen ITM Blog - Discipline or Denial

What I ignore

But what I don’t look at are opinions. There are always heaps of them and they are easy to recognise.

Nvidia Falls 8% After Earnings

This is a headline I would read – it is going to give me facts on what is going on which will help my understanding. On the other hand:

Market crash Imminent!

I won’t read it. It is a prediction dressed up as news, usually written to attract clicks. Adding “expert says” does not turn an opinion into a fact. Don’t rot your brain reading it.

Am I avoiding reality?

No, I don’t think so. It is just me avoiding reality being presented in a way that will make my subconscious become my enemy. OK, maybe enemy is too strong a word. But definitely a very unhelpful friend.

But interestingly, avoiding reality is what people do. But there’s a difference between unconscious avoidance and conscious selective attention.

When investors look away

Research appearing in the Review of Economic Studies in 2026 used brokerage-account data and three experiments to examine when investors paid attention to their portfolios.

Heather Cullen ITM Blog - Discipline or Denial

The researchers found that investors were more likely to log in when a recently purchased stock had gained than when it had lost. This reluctance to look also affected what they did next. When investors avoided logging in after a loss, they became less likely to buy or sell other stocks – even though those stocks had not caused the original discomfort.

Investors, it seems, are not only reluctant to realise losses. They can also be reluctant simply to look at them.

Discipline? Or denial?

So, am I doing exactly the same thing?

No. There is a vital distinction here.

  • Conscious discipline: I have made a conscious decision not to look at an irrelevant dollar figure because I know it can influence my thinking. But I am still looking at the market, checking the evidence and following the ITM
  • Unconscious avoidance: When people are hiding from reality. This is not what we do – we keep an eye on the market, trying to understand what is going on, and watching for our ITM signals.

Sometimes refusing to look is avoidance.

Sometimes it is discipline.

The difference is whether you are still paying attention to the information that matters.

Heather Cullen ITM Blog - Discipline or Denial

To the markets . . .

Not a bad week. Not exactly memorable. But perfectly acceptable.

SPY Charts

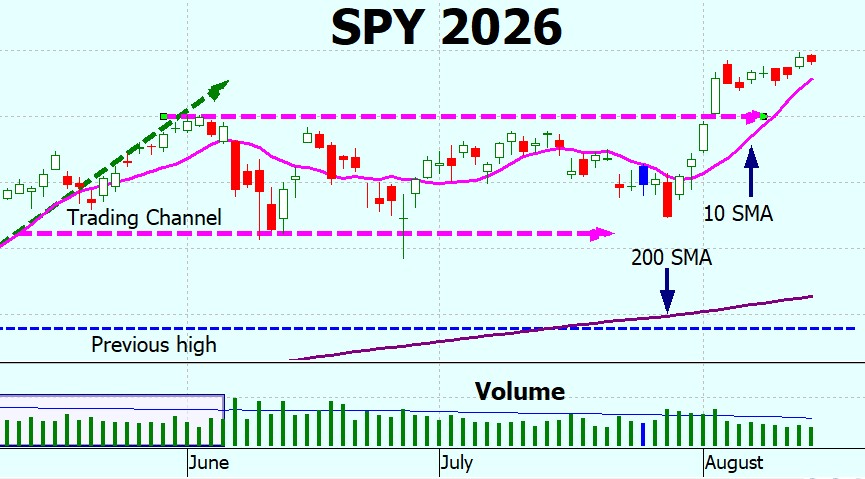
SPY seems inclined to stay above the $760 level which is good news. It has had a series of short candles on relatively low volume so it seems that investors are taking a breather – not inclined to push the prices down, but also not enough energy to push them higher.

So, it is drifting sideways – but slightly upwards. The 10-day SMA is pulling away from the 200-day SMA, so it seems a death cross is not imminent.

I really shouldn’t say things like that – tempting fate I always think.

‘The main purpose of the stock market is to make fools of as many men as possible.’

Bernard M. Baruch

I think that includes women too!

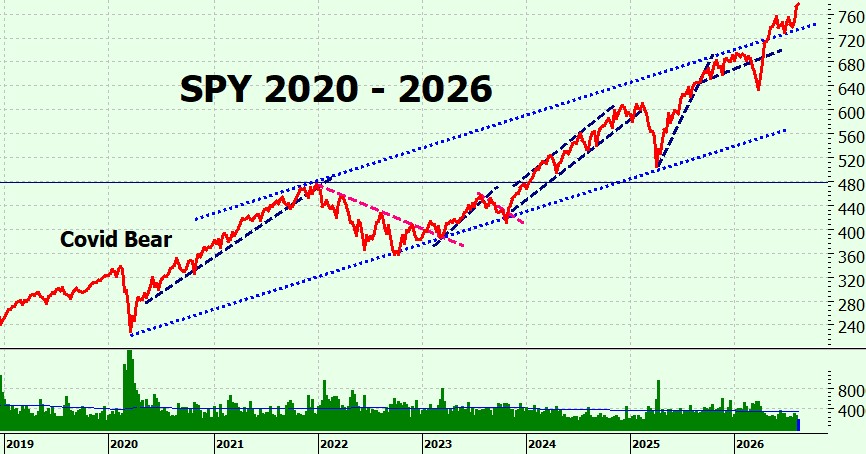
On the long term chart, our hope that the top bound would become the new support line seems to be being fulfilled.

Heather Cullen ITM Blog - Discipline or Denial

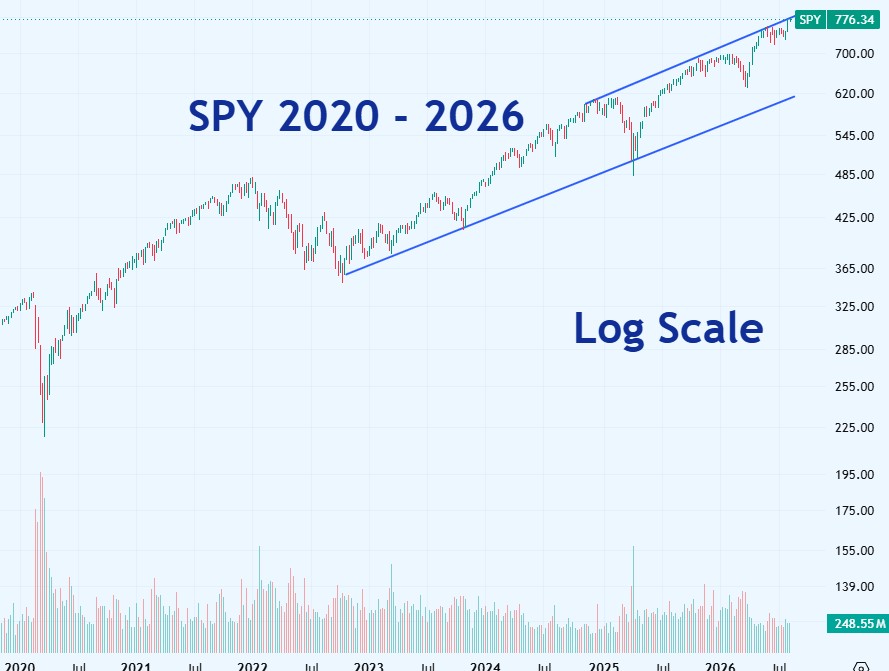
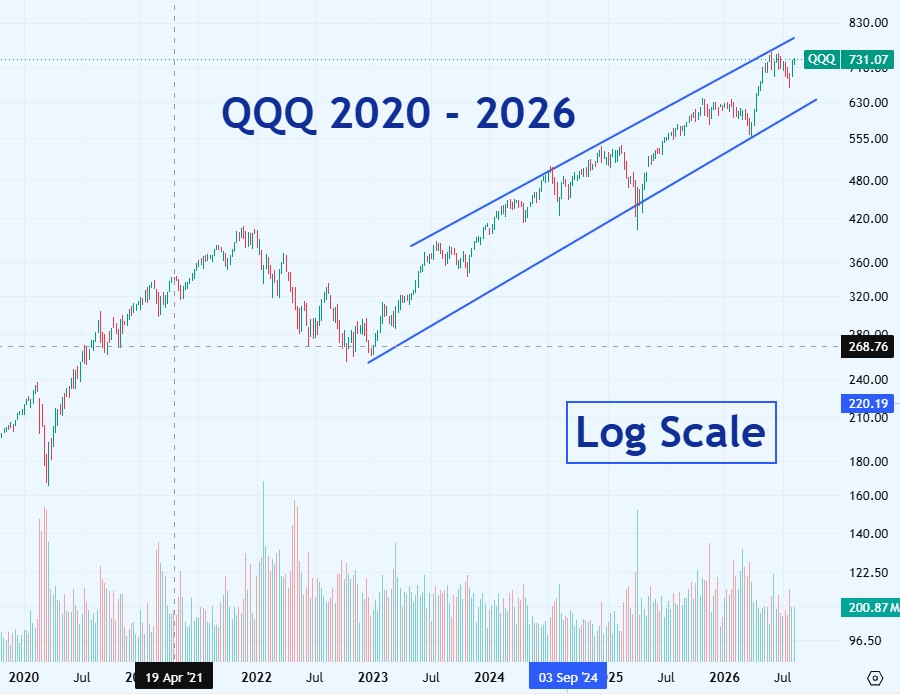
Last week I mentioned that perhaps we should, from time to time, look at things on a log scale. A log scale shows equal percentage changes as equal distances, rather than equal dollar changes- so a rise from $50 to $100 looks the same size as a rise from $250 to $500.

So what does this log chart tell us that the previous chart doesn’t?

Not a lot really, apart from the covid bear being much more pronounced. Why is it not much different? Because in the scheme of things 6 years is not that long a time. If we went back 50 or 100 years a log chart would be much more useful.

SPYG Charts

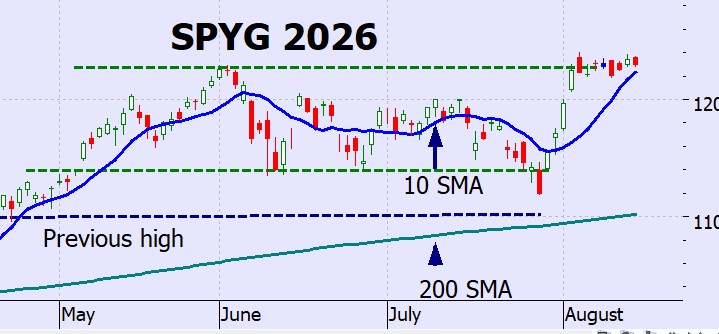
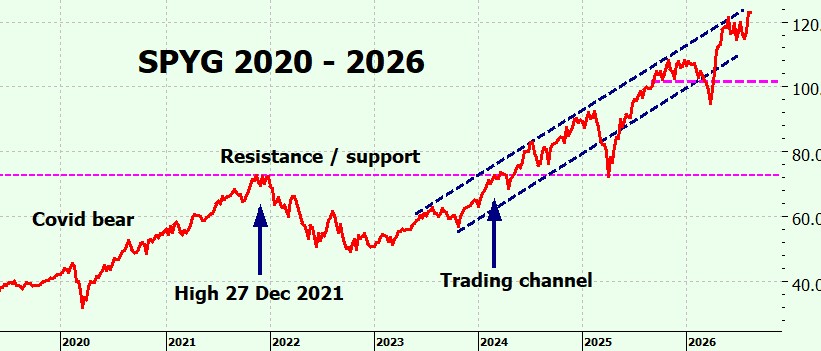
SPYG is crawling along the level of the previous high (once again I am amazed at how accurate simple things like support / resistance lines ca be). As for SPY, the 10-day SMA is pulling away from the 200-day SMA

Longer term SPYG has returned to the upper bound. It would be nice if it pierced it and followed SPY’s pattern.

QQQ Charts

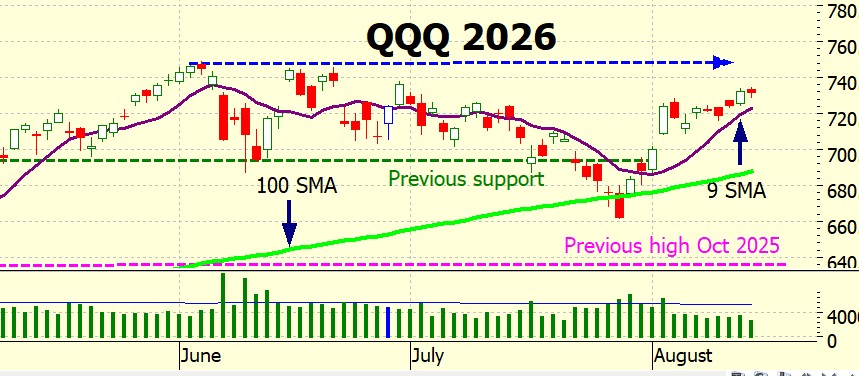
QQQ is trending upwards – slowly and with short candles – heading towards the previous high of $746 on 2nd June. It is possible that we may see resistance at that level – but we’ll have to wait and see.

Heather Cullen ITM Blog - Discipline or Denial

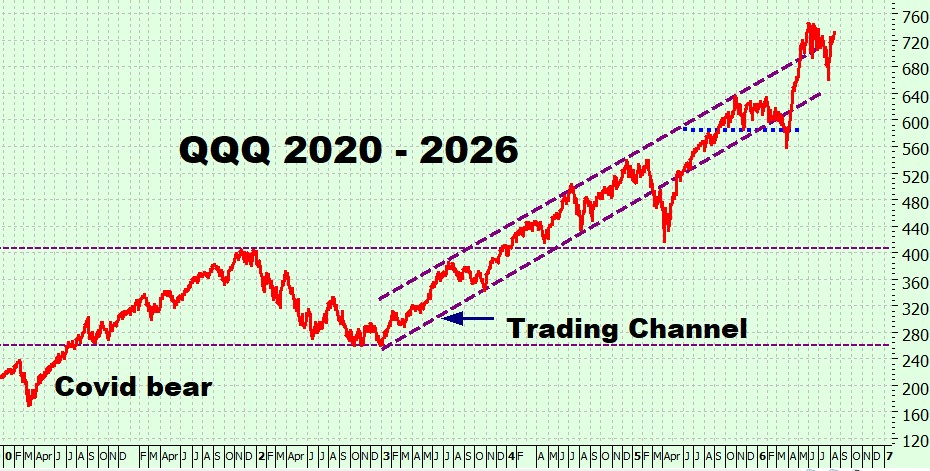
Longer term it is back above the upper bound – lets hope that it decides to make this it’s new trend line!

Heather Cullen ITM Blog - Discipline or Denial

Looking at the log chart I don’t think it gives us any more information. See next section for comments.

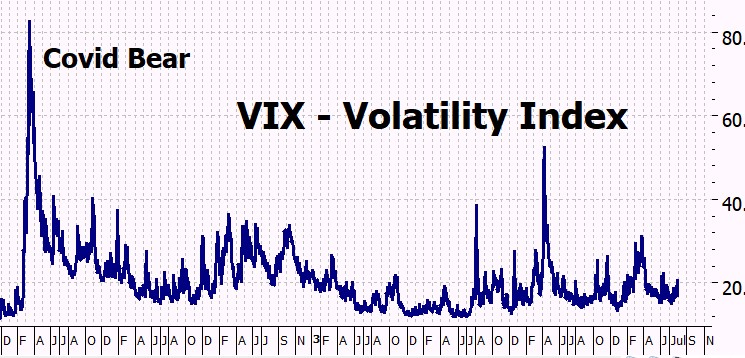
Vix Chart (Volatility)

Nothing much happening with the VIX – but that’s the way we like it!

Heather Cullen ITM Blog - Discipline or Denial

Log Charts

I will continue to look at log charts from time to time – definitely when we are examining very long-term trends.

But for the charts we use each week, I want support and resistance levels to be immediately recognisable and visually consistent with the daily charts. A log scale does not remove those price levels, but it changes the spacing between them. That can make familiar levels and trend lines look different and makes it harder to move quickly between the daily and longer-term charts.

Over six years, the log chart does not seem to add enough useful information to compensate for that loss of visual continuity. So I don’t think I will include it regularly – but you can create one whenever you like at HeatherCullen.com/Charts.

ITMeter

Heather Cullen In The Money ITM BLOG Options Nuts Bolts

The week ahead . . . . .

The main market-moving event is likely to be Wednesday’s release of the July Federal Reserve meeting minutes. Retail earnings will also be important, with Home Depot, Target, Lowe’s and Walmart reporting during the week.

Monday 17 August

Announcements: Empire State Manufacturing Index, NAHB Housing Market Index.

Earnings: Fabrinet.

Tuesday 18 August

Announcements: Building Permits, Housing Starts, Import Prices, Industrial Production, Capacity Utilisation, Pending Home Sales.

Earnings: Home Depot, Baidu, Amer Sports, Keysight Technologies, Toll Brothers.

Wednesday 19 August

Announcements: FOMC Meeting Minutes.

Earnings: Analog Devices, Lowe’s, Target, TJX, Estée Lauder, Bill.com.

Thursday 20 August

Announcements: Weekly Jobless Claims, Philadelphia Fed Manufacturing Index, Leading Economic Indicators.

Earnings: Walmart, Alibaba, Deere, NetEase, Ross Stores, Advance Auto Parts.

Friday 21 August

Announcements: S&P Global Flash Manufacturing PMI, S&P Global Flash Services PMI.

Earnings: BJ’s Wholesale, Buckle.

The major retailers will provide a useful picture of consumer spending. Home Depot and Lowe’s should also offer evidence about housing-related demand, while Walmart and Target will show how consumers are responding to continuing pressure on household budgets.

Analog Devices and Keysight Technologies will provide further evidence about demand for semiconductors and electronic-testing equipment. Baidu, Alibaba and NetEase may also offer useful indications of spending on AI, cloud services and the Chinese technology market.

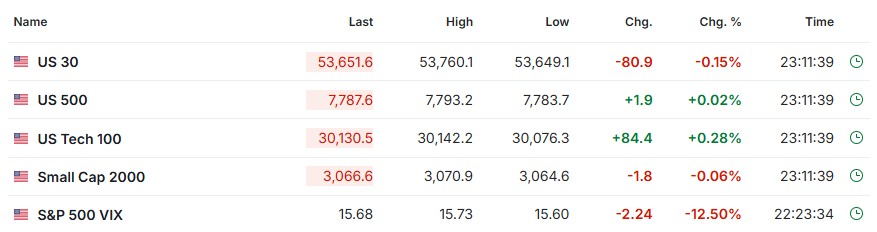
The futures . .

The futures look slightly positive – well, tech does. But it is still 11 hours to market open.

Heather Cullen ITM Blog - Discipline or Denial

Next week . .

I’ve been promising to do a blog on the VIX (often called the fear index) and I will next week. But when thinking about it, it raised the question:

Why isn’t there a greed index?

An interesting question – we’ll see why next blog.

Hoping for a great week!

Heather

Trade the tide- not the waves

Q & A

10 Responses

  1. Heather, I find myself out of the market with my ITM portfolio sleeve, now for some time, as I got out at the last exit earlier this year and missed the entry as I was distracted with personal issues. I have been “waiting” on the market to tell me when to reenter and have not heard the call. Entering now with such a high basis versus an exit at the 200 seems to be low potential reward versus high risk. Do I average in? What do you tell an ITMer at this juncture?

    1. HI Doug – yes, life gets in the way sometimes, doesn’t it?
      There is no ‘reenter’ ITM sign – if the ITMeter is pointing to ‘bull’ then it is OK to jump in. Of course you won’t have exactly the same results as someone who go in at the golden cross – but if you wait for another one you may be waiting for years!
      I’ve written some blogs on this situation in the past – have a look at them:
      https://heathercullen.com/blog/riding-the-bull/
      https://heathercullen.com/blog/is-it-too-late/
      https://heathercullen.com/blog/market-peaks/
      The ITM backtesting has to go from golden cross to death cross – it is quite impossible to backtest for every possible entry point – but I have always found that whenever I waited for a ‘better time to get in’ I always missed the boat and kicked myself.
      Remember – in a bull run ‘market highs’ are made every week or two – it isn’t an isolated occurrence.

      Hope this helps – if no then pls get back to me.

      h

  2. Hi Heather,

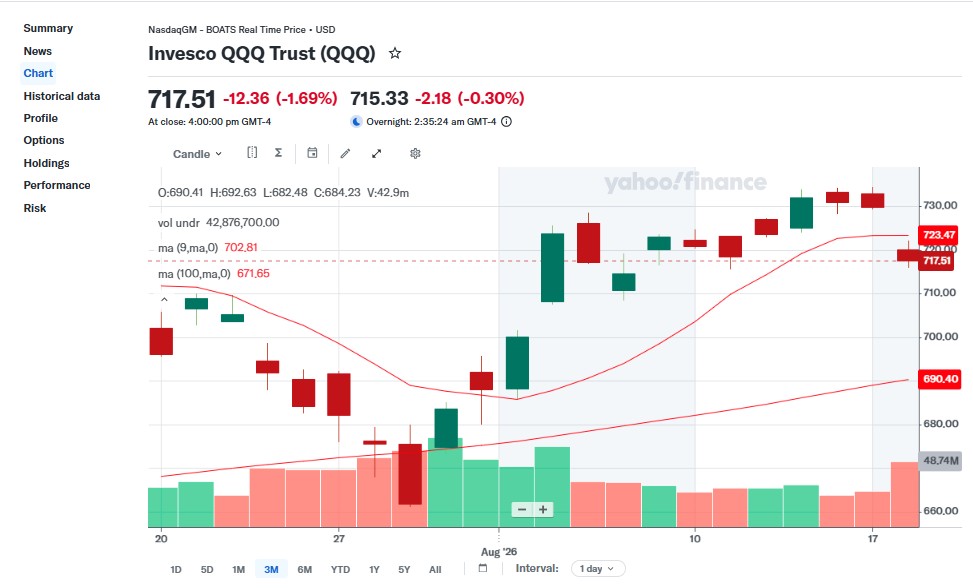
    I like the images of the bull and bear too. They give me a chuckle when reading your blog. Question for you-why do my charts in yahoo finance not look the same as yours on your website? I’m using the 9 sma and the 100 sma but on yahoo finance, the lines crossed each other on August 14th for the QQQ.

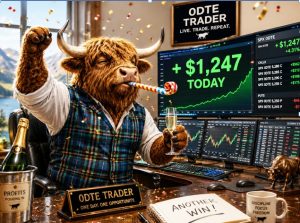
    1. Hi Charity – glad you like Bull & Bear – Writing about the stock market needs a bit of levity I always think. And it is good for my brain to thik outside the normal box and figure out ‘how can I make this illustrate what I am talkig about in 4 / 5 images. Actually its the bit I like doin most)
      Re Finance – I’ve been on Yahoo Finance charts trying to recreate what you are seeing – but I can’t. So just check: Interval (at the bottom) is 1 day using the SMA 9, 100?I can’t post a screenshot insdie the coments so I will do it underneath them.
      Have a look and get back to me.
      h

      1. Hi Heather,

        Thank you for the reply and the chart. When I went in later that day, all my saved settings were gone, and I had to re input them. So, I’m thinking there is a glitch in their system because then it looked just like your chart below. Now I know to not always trust just their charts but to check the charts on your website or to do them in my trading platform. Is there a way to save the sma’s on the charts you have a tab for?

        1. HI Charity – I believe there is – I tend to use OptionGear for charts (not recommending it – $50 per month! but I am used to is to very quick) so not familiar with how you do it in the charts on my website which are sourced from TradingView.
          But eveudently you can:
          Look at the top-right corner of the TradingView interface next to the layout name.Click the layout name or the Save cloud icon and make sure Autosave is toggled on, or press Ctrl + S (Windows) / Cmd + S (Mac) to manually save.To create a separate workspace, click the dropdown arrow next to the layout name and select Save As… to name a new custom layout.
          And here’s a video explaining how you do it: https://www.youtube.com/watch?v=W1wZDp8TbCY
          Hope this helps
          h

  3. Hi Heather

    I just wished to comment how much I like your weekly blog. The Bull/Bear pics are really fun and enhance the enjoyment of your text and charts.
    You make the beginning of the week something to look forward to, whether the market is up or down.

    Roger

    1. Hi Roger – thank you, glad you like the blog.
      I am just finding my way with the idea of the characters (the Blackwatch Bull and the polar bear) trying to give them personalities, and to try to light-heartedly illustrate what I am trying to say in words.
      I kind of wondered itf I was only amusing myself – so it is nice to hear someone gets it!
      Thank you!
      h

  4. “ fools of as many men as possible.” “ the lemmings “ Somebody should put all of those in a book… or a Peter Lynch on charts. A monkey throwing darts at a newspaper in a bull market. I think the darvis box looks almost like a point and figure chart of X s and O s in the days of old. Have you asked Ai about the future of money • robots and Ai • UBI s. ChatGPT has an opinion on that too . The time between Sunday evening and Monday morning is when I actually read • and look at your charts. Be well!r

    1. Hey Randy – thank you!
      You are right about all the great quotes – often when I am writing I get the vague memory of one in my mind – and the lovely thing about AI is it can track it down instantly even if you can only remember a few words.
      ChatGPT – the future of money? actually, I am proably rather unadventurous with AI – I use it toe research and to make sure my facts are coorect – but I don’t ask it questions like ‘what is the meaning of life’.
      Actually, that counds fun – I’ll do it!
      (and the answer probably isn’t 43 – or was it 45?)
      h

Yahoo Chart for Charity – see comment above

Heather Cullen

ITM Blog

Heather Cullen

Thank you – your message has been sent.

You will be notified when there is a new blog post.


Please note that Heather answers all questions at the end of the ITM Blog.


Happy trading!