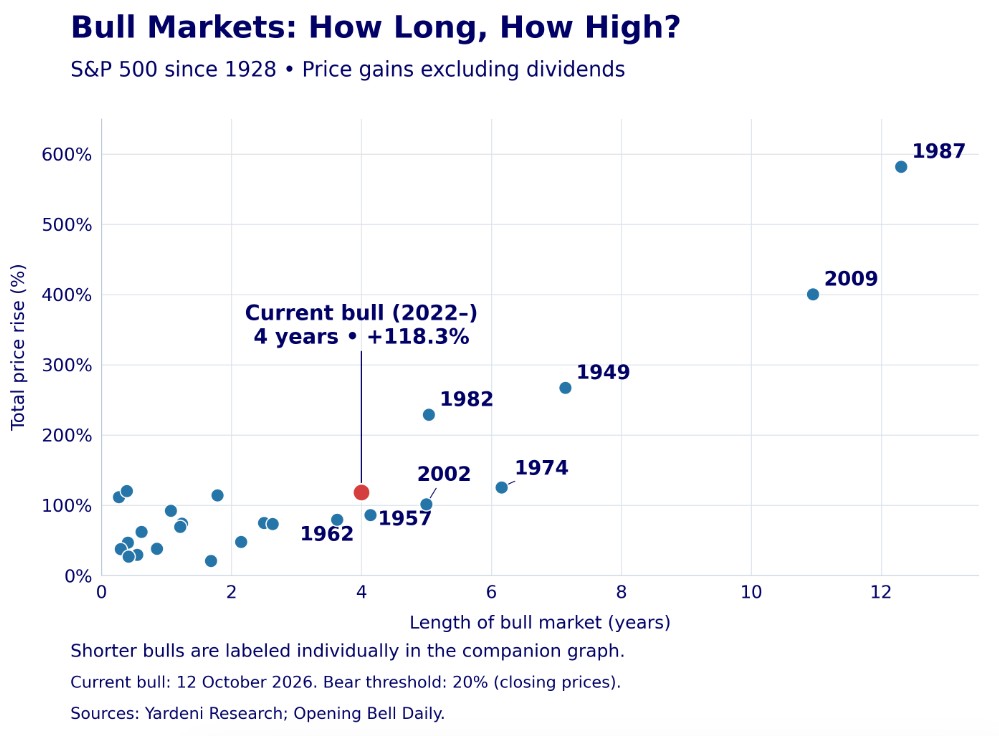
Our bull market is getting a bit long in the tooth – or is it? Here are all the bull markets for the last 100 years with their duration measured against the rise. Our current one (which has not yet ended) is marked red.
So definitely not an outlier. Not particularly long and not particularly high. We’ve been going 4 years, and risen 118%. Does that prove it isn’t a bubble? No. But being four years old and up 118% doesn’t prove it is one either.
The clear outlier was the bull market starting 1987 – 12 years and almost 600%. Nice. 2009 was no slouch either: 11 years and 400%.
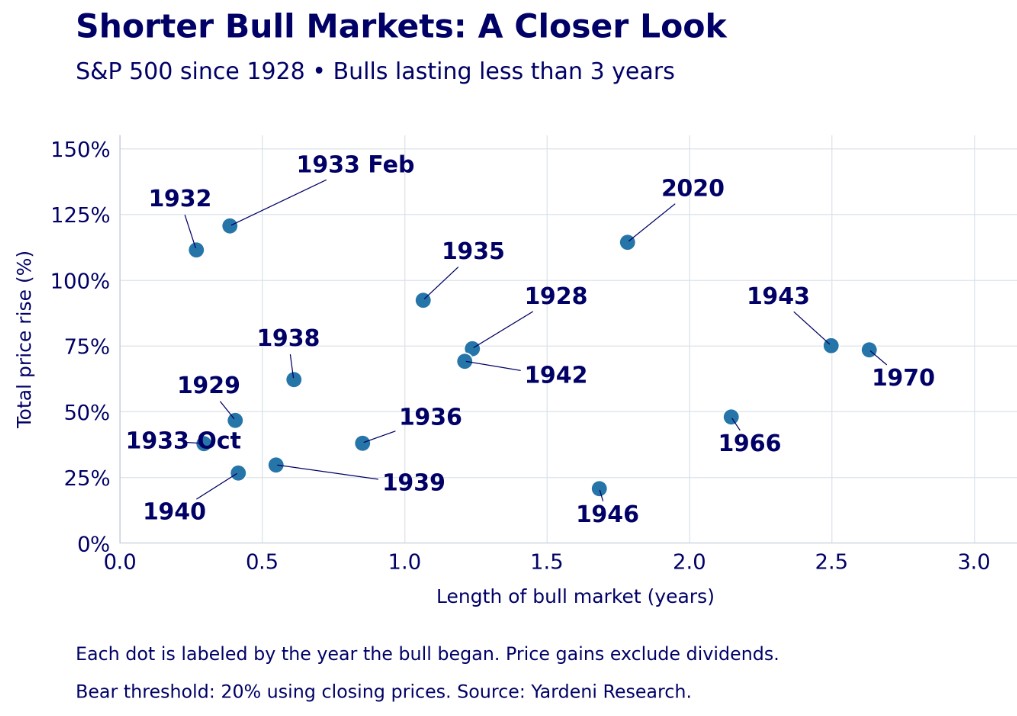
Let’s have a closer look at the shorter ones all bunched up on the bottom left corner.
Bull markets can go on a long time
Of course, with hindsight we think that it would have been great trading in either the 1987 or 2009 bulls – but remember when you are trading you are up against the right hand side of the chart, not able to see what was going to happen. And that could be scary too. You can spend years wondering when it is going to end.
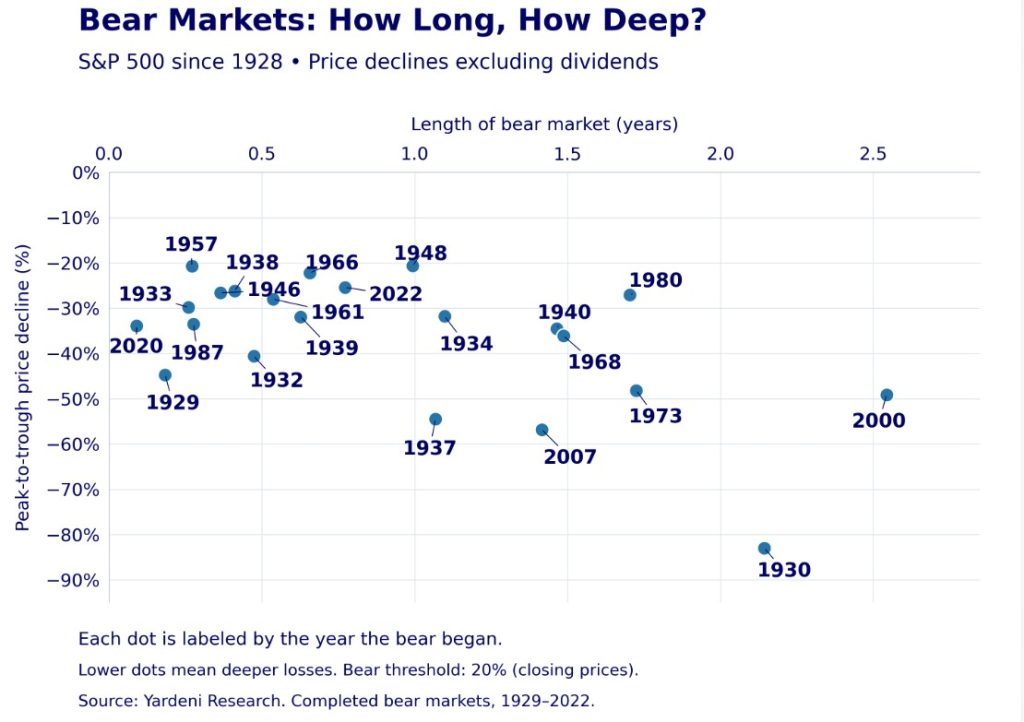
Bears are not so long or so deep.
Well, that is obvious. A complete market crash would mean a maximum drop of 100% whereas the market can rise as high as it likes.
The 1930 bear was a shocker – over 80%. 2007 also bad. Not great for the buy-and-hold crowd.
Bears & Bulls Together
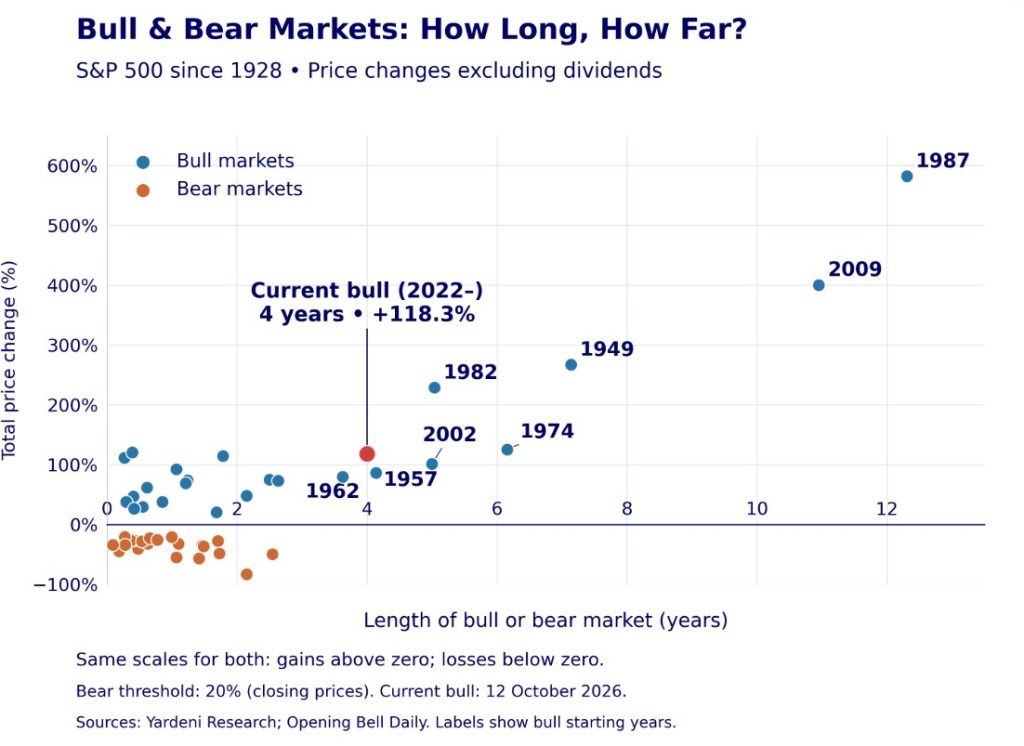
Putting them on the same graph, the bears look almost modest: shorter, with smaller percentage moves. But your account may tell a very different story.
A Winner’s Game?
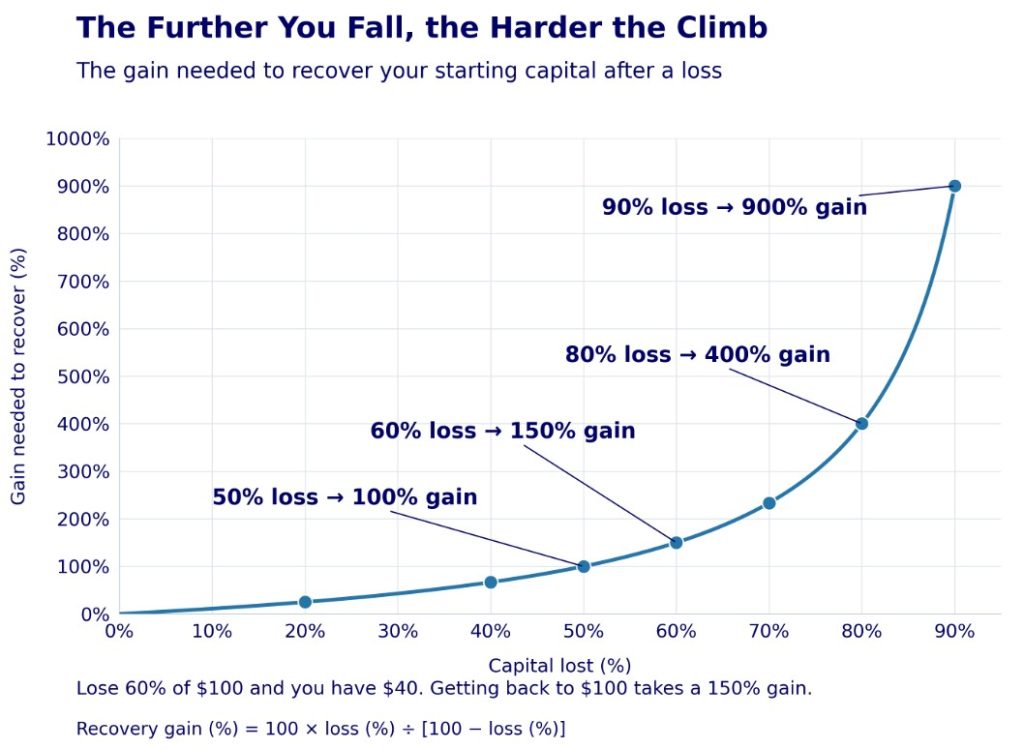
Bulls last longer and rise further. Looks like an easy game, doesn’t it? But percentages play a nasty trick. A 50% fall does far more damage than a 50% rise can repair.
A 50% loss means you need a 100% rise to get back to where you started. A 60% loss needs a 150% rise. And an 80% loss needs a 400% rise.
The 1930 bear was a shocker – down 83%. Not great for the buy-and-hold crowd. If you had ridden it out it would have taken you until 1954 – a quarter of a century – to get back to even. The bear starting in 2007 took 57%, not nice either.
Dodging the Bear
Much of ITM’s success has simply been avoiding capital-depleting downturns. Of course, we can’t avoid drawdowns – unless the market heads south we won’t get an OUT signal. We just have to accept that we don’t know the peak until later.
But we don’t want to be jumping at every shadow; market dips are normal, and we don’t want to have to get out only to have to get back in again. That does sometimes happen in a sideways market – but the ‘white space’ requirement reduces the whipsaw effect.
The ITM Plan
We don’t have to catch every rise or dodge every dip. We need to stay with the bull while it does its work, and get out before the bear eats too much of our capital. The less we lose, the less we have to make back—and the sooner we can start making progress again.
So how much longer does this bull market have? Nobody knows but with ITM we don’t need to.
** All market returns and recovery periods shown exclude dividends
To the markets . . .
A particularly nasty week. Especially Friday when everyone seemed to head for the hills. Let’s take a look:
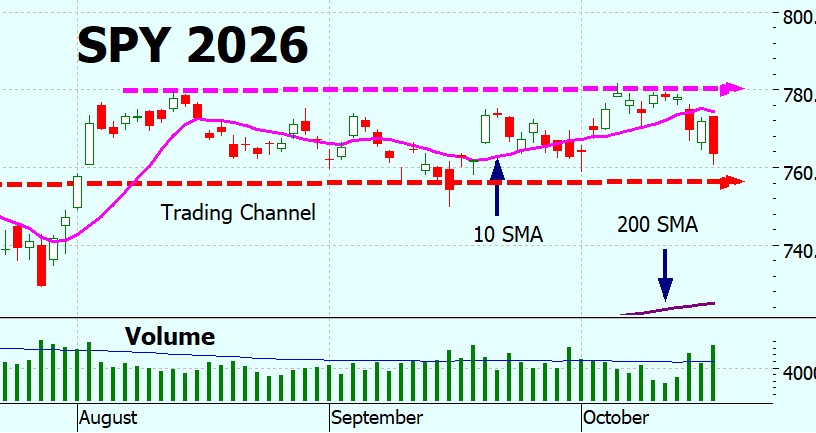
SPY Charts
Our hope that SPY was finally going to break out of its trading channel was not realised. It bounced off what we thought would be resistance (pink line), and headed south. Sometimes you wish you weren’t right – I would rather have been wrong and it went up!
Hoping that the bottom of the channel (red line) holds and that it has another go at breaking out – upwards, of course.
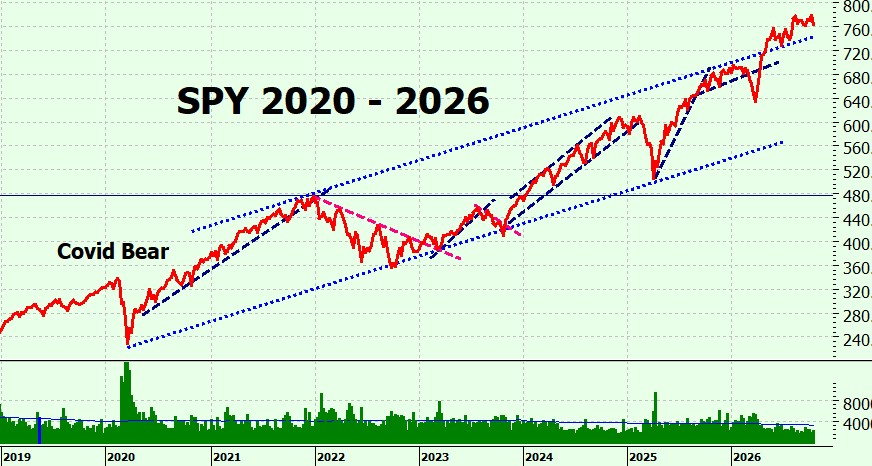
Longer term, no surprises, still on the uptrend.
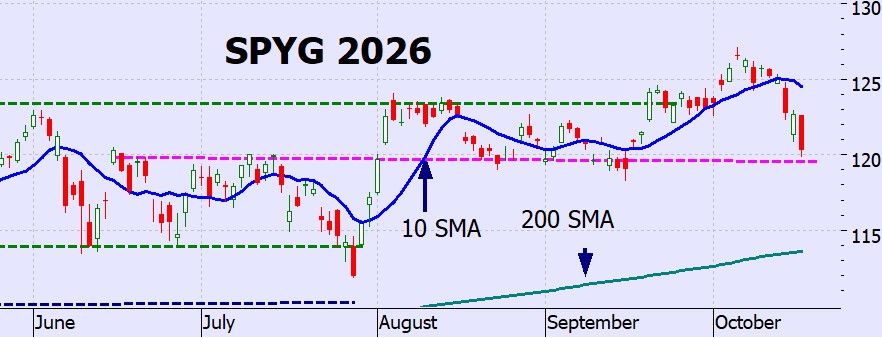
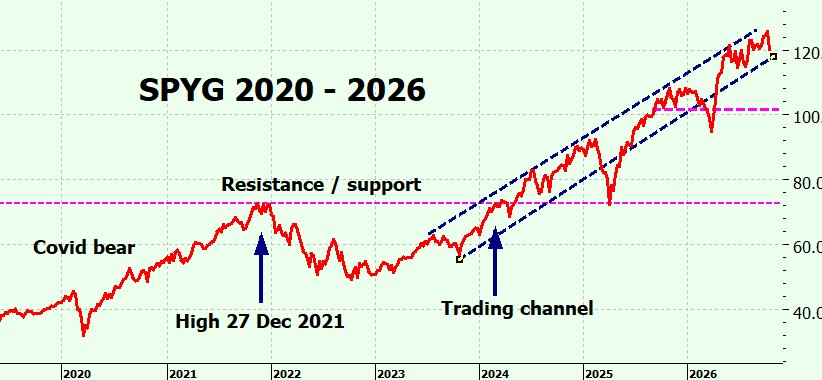
SPYG Charts
SPYG following exactly the same pattern – back to the bottom bound of the trading channel. What a shame – after we had such high hopes for it finally escaping.
Longer term, it is heading to the bottom of the trading channel – hopefully it will bounce off.
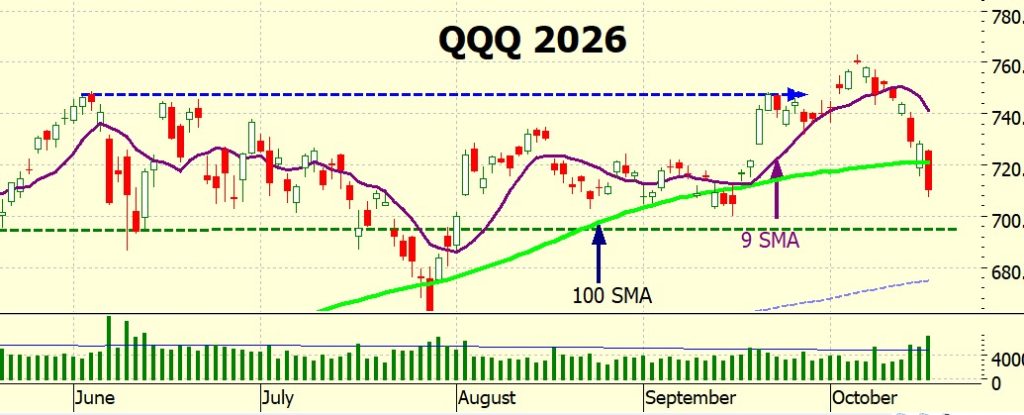
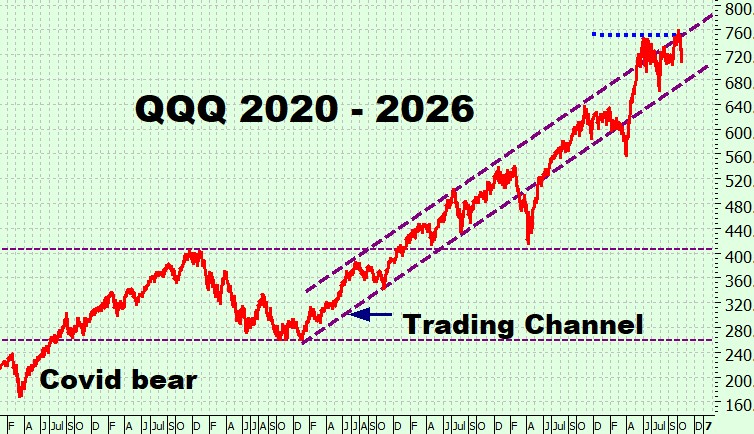
QQQ Charts
The Nasdaq did not have a good week, Friday being particularly nasty – down over 2%. We’re not near a death cross just yet, but we must be alert – watch and wait. Hopefully, support (green dashed line) at around 700 will hold.
Longer term, its right in the middle of the trading channel.
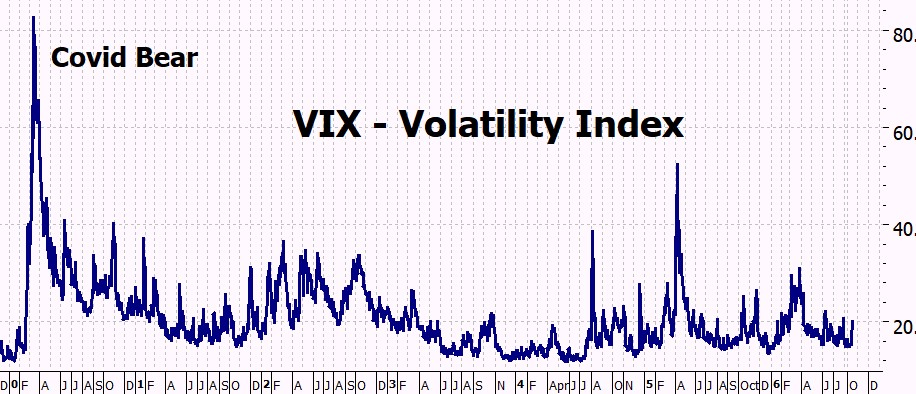
VIX Chart (Volatility)
The VIX is slightly elevated.
ITMeter
The ITMeter still says OK to enter a bull trade on all three indexes.
The ITM Replication Pack has now been downloaded 93 times – and the figures still stand. Please – if you want to check the results do so, here’s the link: ITM Replication Pack
The Week Ahead
Earnings take the spotlight this week, with Netflix on Tuesday and Meta, Tesla and IBM on Wednesday. Housing figures arrive early in the week, followed by Friday’s business surveys and consumer sentiment report. Together, they’ll give us a look at corporate profits, business conditions and how consumers are feeling.
Monday 19 October Announcements: October NAHB Housing Market Index, measuring homebuilder confidence. Earnings: Cleveland-Cliffs, Fifth Third Bancorp, Steel Dynamics and Zions Bancorporation.
Tuesday 20 October Announcements: September housing starts, building permits and pending home sales. Earnings: GE Aerospace, General Motors, RTX, Northrop Grumman, 3M, Netflix, United Airlines and Intuitive Surgical.
Wednesday 21 October Announcements: Weekly mortgage applications and U.S. crude oil inventories; no major economic releases. Earnings: Meta, Tesla, IBM, Lam Research, Texas Instruments, AT&T and Abbott Laboratories.
Thursday 22 October Announcements: Weekly jobless claims, September Leading Economic Index and October Kansas City Fed manufacturing survey. Earnings: Procter & Gamble, Lockheed Martin, Honeywell, American Airlines, Comcast, Blackstone and Western Digital.
Friday 23 October Announcements: October flash manufacturing and services PMIs; final University of Michigan consumer sentiment and inflation expectations. Earnings: American Express, SLB, Autoliv and Booz Allen Hamilton.
Wednesday’s earnings are likely to attract plenty of attention, particularly what Meta says about AI spending and what Tesla delivers on profits. Friday’s surveys will tell us more about business activity and consumers’ expectations. Plenty for the market to react to – but we’ll keep watching the tide and following The ITM Plan.
The Futures
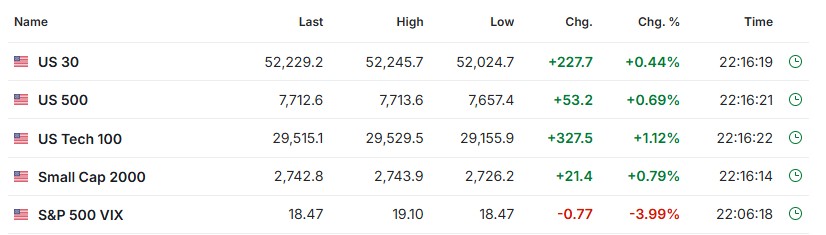
. . . are looking positive at this stage – but 11 hours to market open.
Next week . .
I stopped doing the weekly videos as interest seemed to be tapering off, so I have removed them from public view. I decided that they just weren’t interesting enough – so I tried my hand at using animation. Here’s the first one.
Let me know what you think in the comments below – just be kind!