

Midterms & Markets.
The midterms are coming up – what is likely to happen to the market? I’ve been promising to do this blog for a few weeks – and avoiding it because I knew it would involve a lot of research. But it is important, so here goes. Let’s start by looking at all the midterms this century.
Midterm Dates
Year | Date | President (term) |
2002 | Tuesday 5 November | George W. Bush (1st term) |
2006 | Tuesday 7 November | George W. Bush (2nd term) |
2010 | Tuesday 2 November | Barack Obama (1st term) |
2014 | Tuesday 4 November | Barack Obama (2nd term) |
2018 | Tuesday 6 November | Donald Trump (1st term) |
2022 | Tuesday 8 November | Joe Biden |
2026 | Tuesday 3 November | Donald Trump (2nd term) |
What did the market do?
Leading into the midterms there have been a couple of negative results – 2018 and 2022, but afterwards the trend has been upwards. Of course, the midterms are not the only thing affecting the market – we’ve had a couple of major bears during this time.
Midterm | 3 months before | 6 months after | 12 months after |
2002 | +8.8% | +2.0% | +15.8% |
2006 | +8.2% | +9.4% | +6.9% |
2010 | +5.2% | +14.9% | +4.5% |
2014 | +4.1% | +4.8% | +4.2% |
2018 | −3.9% | +7.1% | +12.4% |
2022 | −8.0% | +8.7% | +15.1% |
Average | +2.4% | +7.8% | +9.8% |

Did the result affect the performance?
Here’s where it gets interesting. Most midterms swing against the incumbent – people want to punish them I suppose! Since 2000:
In the Senate (100 seats)
Year | Seats before | Seats after | % swing | S&P +6 months |
2002 (Bush, R) | 49 | 51 | +2.0% | 2.0% |
2006 (Bush, R) | 55 | 49 | −6.0% | +9.4% |
2010 (Obama, D) | 59 | 53 | −6.0% | +14.9% |
2014 (Obama, D) | 55 | 46 | −9.0% | +4.8% |
2018 (Trump, R) | 51 | 53 | +2.0% | +7.1% |
2022 (Biden, D) | 50 | 51 | +1.0% | +8.7% |
2026 (Trump, R) | 53 |
|
|
|
We can see that both second-term presidents lost control of the Senate at the midterms. The 2022 result was more complicated: Democrats held control with the support of independents.
And in the House of Representatives (435 seats)
Year | Seats before | Seats after | % swing | S&P +6 months |
2002 (Bush, R) | 221 | 229 | +1.8% | 2.0% |
2006 (Bush, R) | 232 | 202 | −6.9% | +9.4% |
2010 (Obama, D) | 256 | 193 | −14.5% | +14.9% |
2014 (Obama, D) | 201 | 188 | −3.0% | +4.8% |
2018 (Trump, R) | 241 | 200 | −9.4% | +7.1% |
2022 (Biden, D) | 222 | 213 | −2.1% | +8.7% |
2026 (Trump, R) | 218* |
|
|
|

So – does it matter?
I am finding it very hard to see any sort of pattern in the tables, other than that a swing against the incumbent does not seem to make a lot of difference. We also have to consider the two major bears (Techwreck & GFC) which had a massive effect on S&P performance. But maybe it’s when there is a divided government (different parties in control of the Senate and the House). Let’s check:
Divided Governments
Years | President | House | Senate | Divided? | S&P +6 months |
2001 (Jan–Jun) | Bush (R) | R | R* | No | −9.8% |
2001 (Jun)-2003 | Bush (R) | R | D | Yes | −9.1% |
2003–2007 | Bush (R) | R | R | No | +8.1% |
2007–2009 | Bush (R) | D | D | Yes | +7.6% |
2009–2011 | Obama (D) | D | D | No | +11.9% |
2011–2015 | Obama (D) | R | D | Yes | +5.3% |
2015–2017 | Obama (D) | R | R | Yes | +2.4% |
2017–2019 | Trump (R) | R | R | No | +9.3% |
2019–2021 | Trump (R) | D | R | Yes | +19.4% |
2021–2023 | Biden (D) | D | D* | No | +13.8% |
2023–2025 | Biden (D) | R | D | Yes | +16.0% |
2025–now | Trump (R) | R | R | No | +5.0% |
* 50–50, VP’s vote
That didn’t seem to make a lot of difference either:
- Divided govt: +6.9%
- One party control: +6.4%
Other things to notice:
- Both negative results came in 2001, during the dot-com crash, one under unified and one under divided government. The market cycle mattered far more than who controlled Congress.
- The two best starts were both divided governments: 2019 (+19.4%) and 2023 (+16.0%). Each followed a sharp sell-off in the run-up to the midterm, so part of the gain was the market recovering.
Of course, the 6 months after result depends on where the market was AT the midterms – and this is the time period we are interested in given that we are now only a few weeks away.
The Run-up to Election Day
Here’s what happened in the run-up to the midterms in the past:
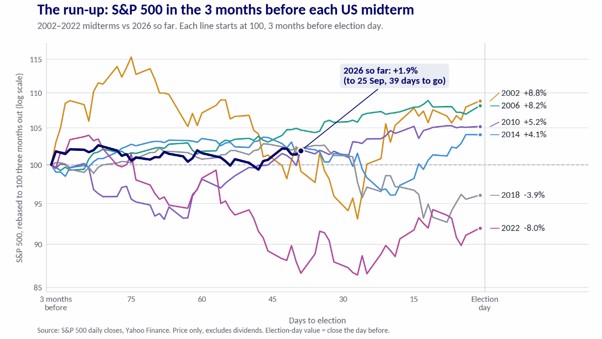
Which is quite a mixed bag. I feel we are looking for patterns where none exist – or at least we don’t have enough data to discern them. We seem to be tracking right in the middle (the navy blue line). The conventional wisdom that there is a sell-off before the midterms isn’t borne out by where the market ended up, although there was usually a scare along the way.

Dips before Midterms
Here are the figures for dips that occurred in the three months before the midterms and the dates:
Midterm | Biggest dip | Low point |
2002 | −19.3% | 9 Oct |
2006 | −1.8% | 3 Nov |
2010 | −7.1% | 26 Aug |
2014 | −7.4% | 15 Oct |
2018 | −9.9% | 29 Oct |
2022 | −16.9% | 12 Oct |
2026 so far | −3.2% | 16 Sep |
That doesn’t look like great news – but is it enough to make a decision? The dates of the bottom of the dips vary widely, from August to November, so it is hard to tell. Five of the six run-ups had a dip of 7% or more, and four of them hit their low in October, which is still ahead of us this year. In four of the six, the market was back above its starting level by election day; in 2018 and 2022 it took three to four and a half months.
Should we worry about the midterms?
I think the answer is probably not. We don’t have enough data to make any sort of decision. I think we can safely ignore the-sky-is-falling headlines which will be coming our way shortly. Dips before the midterms are common, often in October, but they haven’t lasted. They are waves, not the tide.
Stick to the ITM Plan – it will tell you if you should get out.
Far more money has been lost by investors preparing for corrections, or trying to anticipate corrections, than has been lost in corrections themselves.
Peter Lynch
The seat counts in the tables are simplified: caucusing independents, vacancies and changes between elections can make the balance of power more complicated than the tables suggest.

To the markets . . .
Monday was a lovely day, and the rest of the week has been a bit ordinary. Not bad ordinary, just ordinary ordinary.
SPY Charts
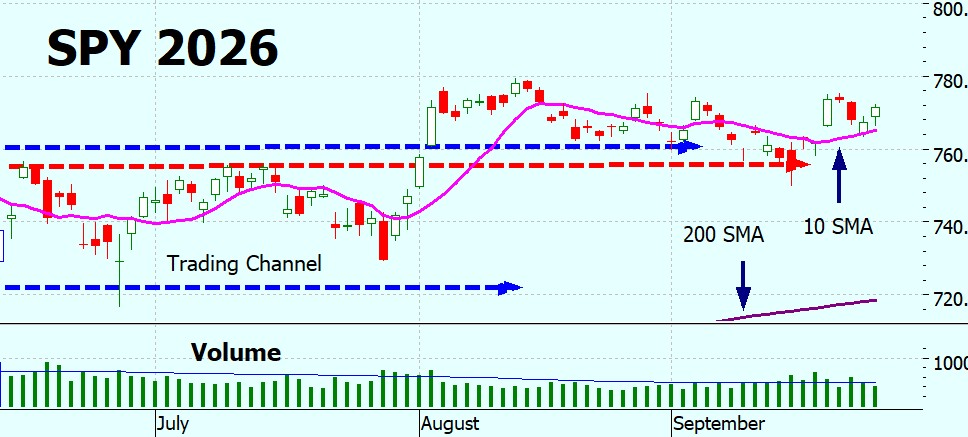
After the nice green candle on a gap up the market has dithered for the rest of the week. Still in its trading channel but it looks as though it wants to challenge the previous high. Or am I reading too much into it? Possibly. But a new high this week would be nice, it is time this market decided what it is going to do.
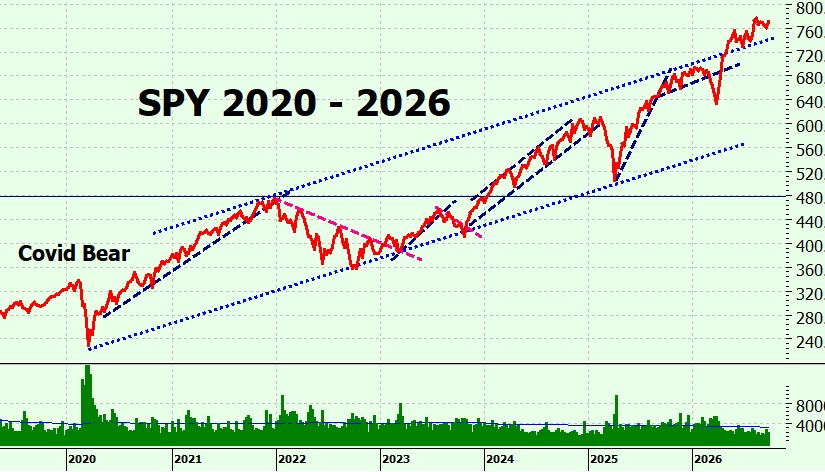
Longer term the uptrend is still holding.
SPYG Charts
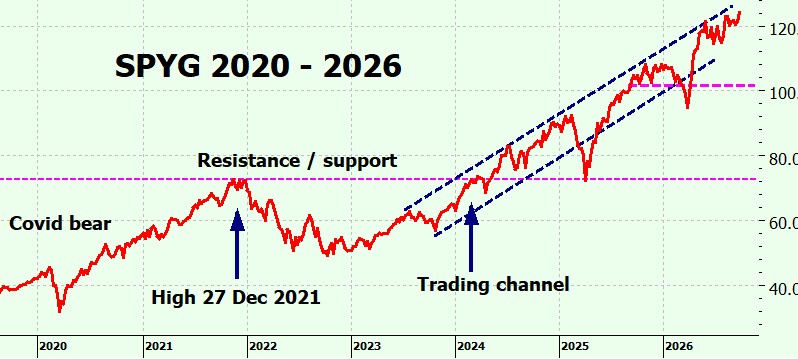
Lovely! SPYG has made new highs. About time too it has been going sideways for months.
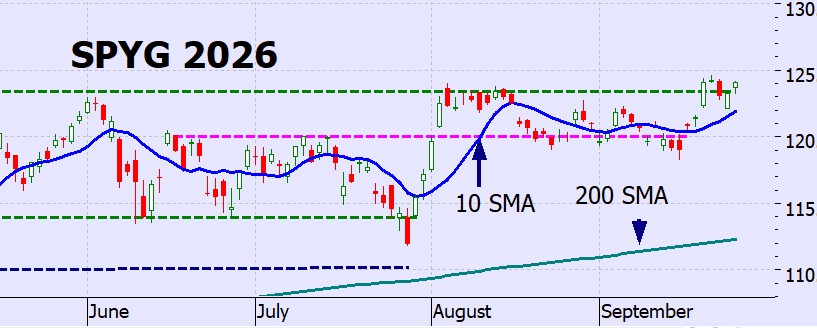
Longer term it is heading up to the top of its trading channel.
QQQ Charts
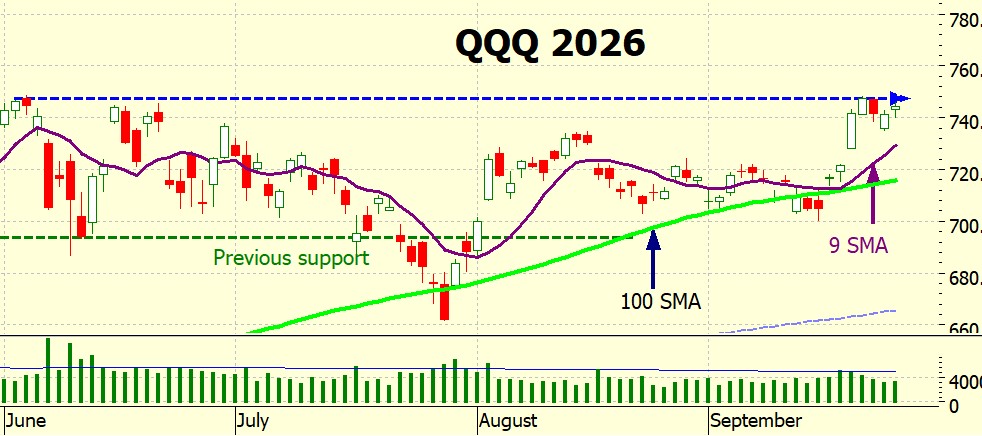
Finally! QQQ made a new high. On Tuesday it closed at $747.46 and the previous high (on 2 June) was $746.16. Ok, not much of a new high, but let’s not look a gift horse in the mouth. Or a gift bull.
Notice how the 2 SMAs met, ‘kissed’ and parted. I think we have avoided the death cross for now.
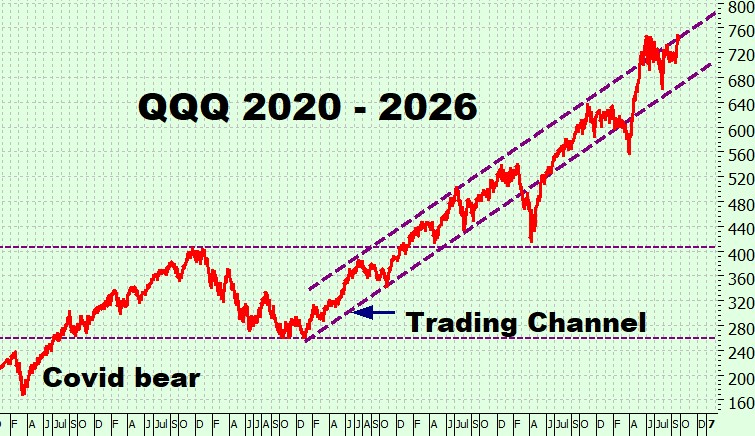
On the long-term chart you can see how it has been bunched up recently but now seems to have made a move upwards.
VIX Chart (Volatility)
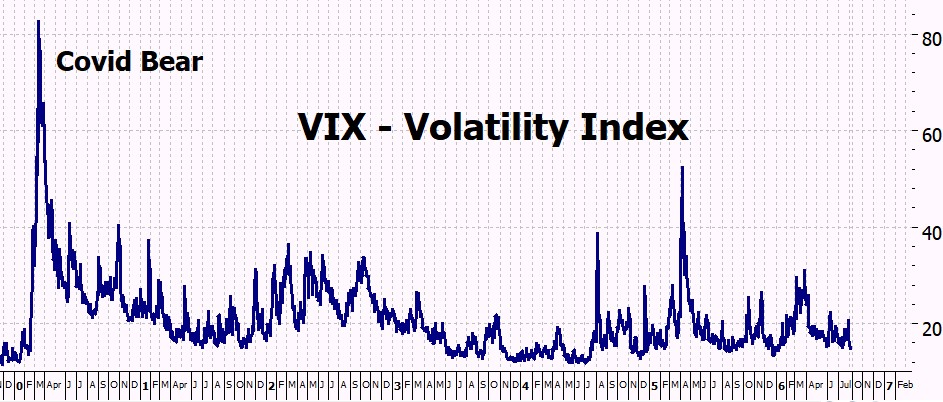
The VIX has settled down and is in low volatility territory.
ITMeter

The week ahead
Jobs and inflation share the spotlight this week. We get job openings on Tuesday, the Fed’s preferred inflation measure on Wednesday, and the September jobs report on Friday. Micron and Nike head the earnings calendar.
Monday 28 September
Announcements: No major economic reports.
Earnings: No major announcements.
Tuesday 29 September
Announcements: Job openings (JOLTS), Consumer Confidence.
Earnings: Carnival, CarMax.
Wednesday 30 September
Announcements: ADP private employment, Personal Income and Outlays—including the PCE inflation measure—and the final estimate of second-quarter GDP.
Earnings: Micron.
Thursday 1 October
Announcements: Weekly jobless claims, ISM Manufacturing Index, construction spending.
Earnings: Accenture, Nike.
Friday 2 October
Announcements: September jobs report, including payrolls, unemployment and wages.
Earnings: No major announcements.
Wednesday’s PCE report and Friday’s jobs figures are the two big tests. One tells us whether inflation is easing; the other shows whether hiring is holding up. Either could shift expectations for the Fed’s next move.
The Futures
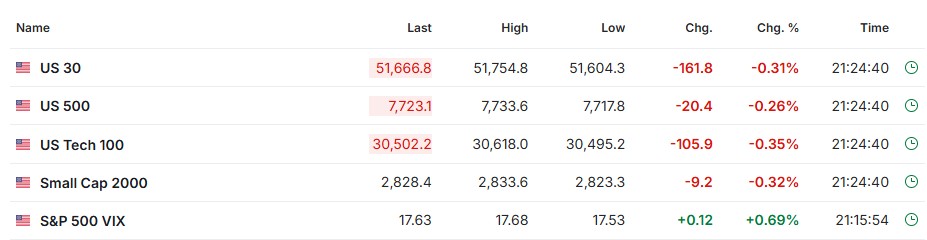
The futures are looking a bit depressed, but it’s still 12 hours to market open.
Next week
I am really pleased with the use of AskITM – I’ve been monitoring it to see what kind of questions are being asked – which gives me a real pointer to places in the book where I haven’t explained things clearly enough. And, yes, finished updating the latest version – the Challenge Edition. The new ITM Calculators, AskITM, updated results are in there – and the ITM Challenge: find a mistake in the backtesting. Everything you need to test it is in the Replication Pack.
The paperback and hardback are ready, but I’ve still got to turn it into an eBook, a laborious, boring process that I am not looking forward to. Will update on progress next week.
Hoping for a good week and new highs!
Heather
Trade the tide not the waves
Test your powers of observation: did you notice the AI mistake in the images?
Comments
Related Posts
- No More Bull Markets!
No More Bull Markets! I’ve just been told off by Microsoft Word. Smacked on the…
- Bull Markets
How long do bull markets last? What we are really asking is : how long…
- Elections & Markets
Elections and Markets. How will the election affect the market? I try to keep off…